
Gadget culture
15 hours ago

I am aware that I am losing my audience here, but I'm drafting chapters for a book that will never be published. I trust you are familiar with the various concepts and calculations by now, it's a bit tedious repeating them all.
--------------------------------------------------------
In science, as in real life, you are supposed to compare like-with-like.
If you run experiments to see how high a ball bearing will bounce, you are only supposed to change one variable, so...
a) You drop a ball bearing, from the same height, onto different surfaces (concrete, rubber, wood); or
b) You drop the same ball bearing, onto the same surface, from different heights; or
c) You drop a different size ball bearing (made of the same material as the small one) from the same height onto the same surface.
The results tell you
a) How bouncy different surfaces are; or
b) How the drop height affects bounce height; or
c) How size of the ball bearing affects bounce height.
There is no point dropping a small ball bearing, made of steel, from 10 metres, onto concrete, and measuring how high it bounces. Then dropping a large ball bearing, made of copper, from 12 metres, onto rubber, and measuring how high that one bounces. The latter will bounce a bit higher, we assume.
But what conclusion can you draw? That large ball bearings bounce higher than small ones? That copper is bouncier than steel? That a ball bearing bounces higher if you drop it from higher? That rubber is bouncier than concrete? At least one of those things must be true, but some might not be.
Clear so far? Back to the actual topic...
-------------------------------------------------------
Q1. What is the Consensus' most compelling evidence for the influence of 'greenhouse gases' on the temperature of the hard surface?
A1. The poster boy (or girl?) for this is the planet Venus.
A few agreed facts:
- if you look at it through a visible-light-telescope, you can see that the surface is white (clouds made of H2SO4*, although we don't know that yet), with an albedo 0.75. If you are Isaac Newton, you can also work out its distance from the Sun, its size and its mass (and hence acceleration due to gravity).
- the 'effective temperature' can then be calculated as ~ 230 K (this calculation is really tricky, but let's accept the result as correct).
- with infra-red-telescopes and actual space probes, we have since measured the actual temperature at the hard surface at 735 K, and know that the atmosphere is 95% CO2. There are about one thousand tonnes of CO2 per m2 surface (as opposed to about 6 kg per m2 on Earth).
- therefore, the Greenhouse Effect on Venus ≈ 500 K (on Earth, the same calculation suggests ~ 33 K).
So far so good, no problems there. You know the 'effective temperature'; how high the visible clouds are (50 km - 80 km. let's take the mid-point to be the 'effective surface' = 65 km); what the main gas in the thick atmosphere is and its specific heat capacity etc. You can then work out likely lapse rate (8.87 m/s2 ÷ 1,126 J/K/kg** = 7.8 K/km) and estimate the likely surface temperature by simply adding lapse rate x altitude (~ 7.8 K/km x ~ 65 km ≈ 500 K) to temperature of 'effective surface' (~ 230 K) ≈ 730 K. Bingo!
But the Consensus skips the basic physics, logic and maths and jumps to "It was the one thousand tonnes of CO2 wot dunnit!"
Q2. Why is this a Diagonal Comparison?
A2. Because they are not comparing like-with-like. They calculate the 'effective temperature' of the clouds and then compare it with the temperature of the hard surface. Of course the hard surface is a lot hotter - because it's much lower down than the clouds (which form the basis of our calculation of 'effective temperature') and there's a lapse rate (temperatures go up as you descend from the clouds). You might as well calculate how high our ball bearing will bounce if you drop it from 10 metres; then drop it from 5 metres anyway and be surprised that the observation does not match the prediction.
What if it turned out that Venus is actually a pale grey planet with only a thin layer of white clouds? Our calculation of the 'effective temperature' (based on what you see through a visible-light-telescope) is the same, but this doesn't need much adjustment for lapse rate x altitude to estimate the temperature at the hard surface.
Hey presto, Greenhouse Effect nearly vanished - like on Mars. Mars serves as a good counter-example. It has hardly any clouds, so the 'effective surface' for which 'effective temperature' (based on low albedo of soil = 0.25 i.e. dark red-grey) is calculated is pretty much at the hard surface. That is why there little apparent discrepancy between 'effective temperature' and hard surface temperature and using the Consensus approach, the Greenhouse Effect is only 6 K. The approach is deeply flawed anyway - see A4. below.
Q3. "Hah!" shouts the Consensus, "So you admit that if there were less CO2, the [hard] surface temperature would be lower? So we are correct - less CO2 => lower temperatures; more CO2 => higher temperatures. So CO2 must be a Greenhouse Gas!!"
A3. Sure, if we just remove a lot of the CO2, the temperature at the hard surface would be lower. The thicker the atmosphere, the greater the Greenhouse Effect and vice versa. But if we replaced the CO2 with the same amount of N2 or O2, the temperature of the hard surface would go up a bit (I think), because the specific heat capacity of those gases is lower than for CO2 so the lapse rate would be higher.
Also, saying "So you admit..." is pure polemic and of no relevance to a scientific discussion. And, if you want cheap shots, there is twenty-five times as much CO2 per m2 on Mars than there is on Earth but officially barely any Greenhouse Effect.
Q4. Isn't it a lazy and logically flawed short-cut to compare 'effective temperature' with hard surface temperature in order to estimate magnitude of the Greenhouse Effect anyway?
A4. Yes, good question and I'm glad you asked.
Let's imagine Venus had no clouds whatsoever, and let's assume that like on Earth, the surface temperature goes up 'a bit' as a result.
We then re-calculate 'effective temperature' based on an albedo of (say) 0.25 (dark) instead of 0.75 (nearly white), which means about three times as much solar radiation being absorbed and converted to kinetic energy (heat); which means the 'effective temperature' you calculate will be a lot higher. So the apparent discrepancy between 'effective temperature' and hard surface temperature will be approximately halved (I haven't done the exact number yet).
Does that mean that the very real Greenhouse Effect has halved (or whatever the exact number is)? Of course not - lack of clouds means the temperatures go up, so there's now slightly more Greenhouse Effect!
The reverse logic applies to Mars which has hardly any clouds and so no apparent Greenhouse Effect (using the flawed Consensus approach to calculating it). Nonetheless, Mars has a predicted lapse rate of about 5 K/km (3.71 m/s2 ÷ 736 J/K/kg - the measured value is half that, apparently). But if it did have a layer of clouds at 10 km altitude (I'm not sure if that's physically possible, but let me illustrate the point) it would have an albedo of 0.75 (like Venus); Mars would only absorb one-third as much solar radiation; and the 'effective temperature' we calculate would fall from 209 K to 159 K ((0.333 ^ 0.25) x 209 K).
So - using my method - we would estimate the hard surface temperature on cloudy Mars to be 158 K plus 10 km x 5 K/km = 209 K. This is a bit less than the measured hard surface temperature of 215 K, which makes sense as the clouds would cool it down a bit.
So now, even though the hard surface temperature of Mars has gone down 'a bit' (and the actual Greenhouse Effect has gone down 'a bit' as well), the apparent Greenhouse Effect would go up from 6 K to 50 K! Even though in reality, not much has changed, which means all these figures - 500 K for Venus, 33 K for Earth and 6 K for Mars are meaningless.
* "Poor Jones is dead and gone,
his face will be no more.
For what he thought was H2O
was H2SO4"
** Actually, this is a slightly circular calculation. You would start by assuming the highest layer below the clouds is ~ 230 K, and the specific heat capacity of CO2 at that temperature is lower (0.763 J/K/kg) so you would predict a higher lapse rate of 11 K/km; so you would have to work your way down, km by km and use a different lapse rate each time until you're down at the surface; then work back upwards again until it is all in balance.
... we grappled with the maths
And then we knew that CO2 is
Not a 'greenhouse gas'
Many people over-egg the Venus pudding. From here:

Read it and weep: "Notice how steeply the temperature rises below the clouds, thanks to the planet's huge greenhouse effect."
Well, having looked into all this in reasonable depth over the past few weeks, I notice no such thing. "Steeply rising from the clouds down" is the same as "steeply falling from the ground up", which it clearly doesn't.
The chart shows a lapse rate of about 10 K/km up to 50 km altitude (although the true figure is a bit less than 8 K/km, see below), which is not much more than on Earth's average moist lapse rate actually measured, which is 6.5 K/km ('should be' nearly 10 K/km, but water and water vapour moderate it by one-third, there's little to no water vapour on Venus to moderate it there).
So let's apply the same basic physics to Venus' atmosphere as we did to Earth's and see if we can reconcile it all.
What would we expect the lapse rate to be? Remember, T/h = g/cp.
Gravity on Venus is 8.87m/s2
Specific heat capacity of CO2 at 700K = 1,126 J/kg/K
So lapse rate should be about 7.87 K/km.
Wiki provides more precise figures for the vertical temperature and pressure profile.
Temperature at 0 altitude = 735 K, at 60 km = 263K.
(735 - 263)/60 = 7.87 K/km
That's a good match! (It might seem like fudging to use specific heat capacity at hard-surface temperature, but that's the one you have to work out; it stays pretty constant above that until you are above 99% of the atmosphere).
The Barometric Formula also works pretty well:

Right, next questions
a) what is the 'effective temperature' of the surface of Venus
b) what is the 'surface'
c) what is the actual temperature at the 'surface'
d) what would we predict the temperature of the hard surface to be
e) does our prediction match the actual temperature of the hard surface
a) There is a nice table at the end of this article showing that the 'effective temperature' (expected temperature based on incoming sunlight and assuming no atmosphere but that albedo stays as it is) of Venus should be 232K.
b) What is the 'surface'? If we are looking at 'effective temperature', we should be looking at the 'effective surface' to match, which is whatever the sunlight hits first. Venus has thick clouds between 50 km and 80 km altitude, going by Wiki's more reliable figures. These clouds are very thick/white, which is why Venus has an albedo of 0.75 (0 = black, 1 = white). The 'effective temperature' is based on the albedo of those clouds and that's what the sun light hits first, so the 'effective surface' is the self-same clouds at (say) 70 km altitude.
c) And what is the actual temperature at 70 km altitude.? [Drumroll...] It's 230 K, so a very good match between actual and prediction.
d) With that as the starting point, we can predict the surface temperature, being
232 K 'effective temperature' at 'effective surface' (70 km altitude)
plus 10 km x 3.3 K/km (actual lapse rate between 60 km and 70 km)
plus 60 km x 7.87 K/km (predicted/actual lapse rate for altitudes below 60 km)
= 737 K.
e) [Drumroll...] The actual surface temperature is given as 735K [Cymbal]
-----------------------------------------------------------
Some bonus comparisons while we've got the facts at our finger tips:
1. On Venus, at 50 km altitude, atmospheric pressure is 1.066 atm, in other words, similar to average Earth sea-level pressure; and the temperature is 348K.
Venus gets 662 W/m2 solar radiation, Earth gets 342 W/m2 radiation.
Given those facts and figures, what would we predict Earth's sea-level temperature to be?
348K ÷ ((662 W/m2 ÷ 342 W/ms)^0.25) = 295K.
Earth's average sea-level temperature is given as 288K, so we are in the ballpark.
2. On Venus, at 79 km altitude, atmospheric pressure is 0.006 atm, the same as the pressure at Mars' hard-surface level; and the temperature is 200K.
Mars' average hard-surface level temperature is 215 K. Mars and Venus both have atmospheres that are about 95% CO2, so the amount of CO2 above 80km altitude on Venus and above hard-surface level on Mars is going to be about the same. Venus' atmosphere at that altitude should be far warmer than Mars' hard surface temperature (Venus is a lot closer to the Sun) but we simply don't know why there is a discrepancy here.
3. Yes, you read that correctly, Mars' atmosphere is 95% CO2, but according to Wiki, "The average surface emission temperature of Mars is just 215 K, which is comparable to inland Antarctica. The weaker greenhouse effect in the Martian atmosphere (5 °C, versus 33 °C on Earth) can be explained by the low abundance of other greenhouse gases."
Hang about one cotton pickin' moment here, there isn't much by way of 'other greenhouse gases' on Venus either! What are these mysterious 'other greenhouse gases' anyway?
4. By mass, there is about twenty-five times as much CO2 per m2 of Mars surface than on earth.
Mars: 620 Pascal hard-surface pressure/3.77 m/s2 gravity = 164 kg, x 95% = 156 kg CO2/m2.
Earth: 101,325 Pa/9.807 m/s2 gravity = 10,332 kg, x 400 ppm = 4.13 kg, scaled up by 40/29 because CO2 is heavier than usual N2/O2 mix = 6.3 kg CO2/m2.
156 kg/6.3 kg = 25.
But there's barely any 'greenhouse effect' on Mars... because reasons?
This spring has been a tough one for the Alarmists. All across the world, economies have slowed down, skies have cleared, so that, for instance, Mt Everest is visible from Kathmandu for the first time in living memory. The Alarmist message has been churned out "look what we could do if we only make the effort", neatly avoiding the conclusion if that's all wrecking half the world's economies gets us, then what's it going to take to get the full "save the planet" reduction in emissions. However, from the moment the Lockdown movement spread across the world like wildfire, the weather in the UK has been amazingly sunny.
Now it turns out that May was the sunniest month on record and the Alarmists have a dilemma: do they shout "Global Warming, we're all going to die" and risk people drawing the obvious conclusion that the much-vaunted reduction in emissions seems to have had the opposite effect to what it is supposed to have, or do they just keep schtum and hope people don't notice?
I've been wondering these last few days just when they would crack and, from the BBC article, it looks like the temptation to preach has become just too strong. Mind you, it's reasonably impressive that they held themselves in for this long, but I expect we will be seeing that picture of a starving polar bear again soon.
Emailed in by James Higham, from the BBC:
A man has died after being attacked by a herd of cows while walking in the Yorkshire Dales, police have said.
The man, 82, from Foulridge, Pendle, was out walking with his wife at Ivescar, Ingleton on Saturday at around 13:45 BST.
North Yorkshire Police said emergency services were called but the man died at the scene. His wife, aged 78, was badly bruised and taken by air ambulance to Lancaster Royal Infirmary.
Via @AmbushPredator, SkyNews covered the story, concluding with this:
The Health and Safety Executive says, based on the number of accidents every year, cows are the most dangerous animals in the UK with mainly farm workers and walkers falling victim.
Mainly "walkers with dogs during calving season", if you really want to know.
Having established the real reason for the Greenhouse Effect (yes, there is one), we now have to address why the Greenhouse Effect is less marked than we'd predict using basic physics alone.
We'd predict a temperature at sea-level of about 300K and a temperature of about 200K at the top of the atmosphere, the precise numbers depending on what altitude you choose as starting point (where actual temperature is equal to effective temperature = 250 - 255K) and whether you assume dry lapse rate of 8K/km or 10K/km.
1. As it happens, the Greenhouse Effect is less than this - average temperature at sea-level 288K and average temperature at the top of the stratosphere 213K - the 'moist lapse rate' is 6.5K/km, not 8K/km or 10K/km.
So water vapour is reducing the Greenhouse Effect by about 12K at sea-level, and so it can't be a 'greenhouse gas' (to the extent there even is such a thing).
2. As a matter of fact, humid places not only have smaller day/night temperature ranges than drier places at the same altitude and latitude, they are also on average slightly cooler overall.
3. The main reasons for this are as follows:
a) When water evaporates from the surface, extra kinetic energy (heat) is converted to latent heat of evaporation/condensation. When water vapour condenses back to water droplets higher up, it converts latent heat of evaporation/condensation back to actual kinetic energy (heat). That's a one-way transfer of energy from surface to troposphere.
b) Clouds have a cooling effect in the day time (reflecting solar radiation so it never reaches the hard surface) and a warming effect at night (when clouds reflect some light and some infra red radiation back to the hard surface). That's a two-way thing, but the balance is a cooling effect (see point 2). To complicate matters, the cooling effect is stronger in summer than it is in winter (when it possibly has a slight warming effect).
4. The Consensus argues that water vapour (i.e. H2O in its gaseous 'dry' state, as distinct from water droplets in clouds or fog) absorbs infra red radiation which would otherwise leave the surface and go out to space. Some of this infra red is reflected back to the hard surface and warms the hard surface up a bit more. This is quite possibly true, but it is nigh impossible to split the overall 12K cooling effect into the stronger cooling effects (latent heat and day time clouds) and the weaker warming effects (night time clouds and reflected radiation) and any attempt to do so would be subject to so many estimates and intelligent guesses as to be meaningless.
5. The Consensus also argues that more water vapour will lead to a self-reinforcing cycle - higher hard surface temperature leads to more water vapour; more water vapour reflects more radiation to hard surface; this warms hard surface even more; etc etc. Logic tells us that this can't happen, or else it would have done long ago.
There is no need to speculate about what would happen if sea-level temperatures rise by one or two degrees - the tropics are tens of degrees warmer than the Poles, and most of the tropics are oceans with plenty of water available, and there hasn't been a self-reinforcing cycle there; the overall picture is that water vapour and actual water are a self-regulating, moderating influence.
During the Little Ice Age, temperatures were barely affected in the tropics but went down a lot at higher and lower latitudes. Since then, temperatures have bounced back more at very high and very low latitudes (i.e. North and South Pole, where there is very little water vapour) and haven't risen much in the tropics (very humid). Which again points to water vapour being a moderating influence.
Now that I have finally stumbled across the basic physics (which the Consensus keeps well hidden) that tells you 99% of what you need to know about why there has to be a lapse rate (and hence why the sea level temperature is warmer than you'd expect from solar radiation alone) and how to calculate it (between 8K/km and 10K/km, depending on which method you use - water vapour and water droplets moderate that to the observed 6.5K/km lapse rate), lots of other things just fall into place.
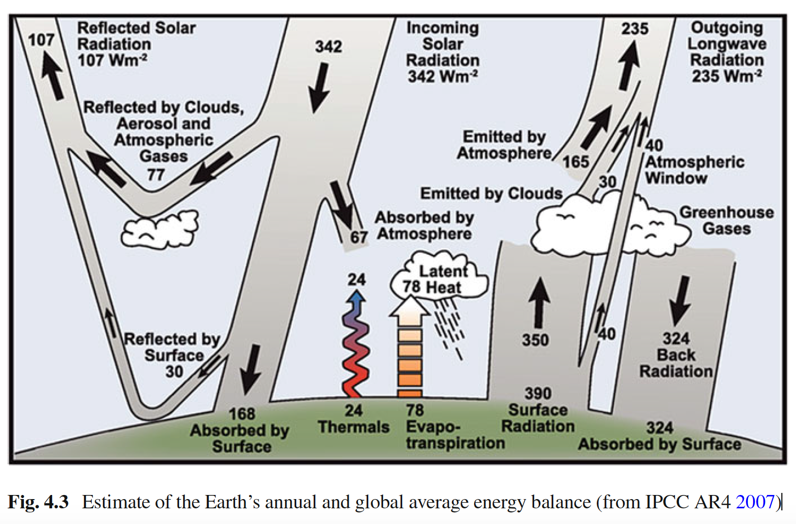
The infamous IPCC 'world energy budget' diagram (scroll down here) shows that the troposphere is emitting twice as much IR radiation back down to the hard surface as it is radiating to space. So with a straight face, the Consensus segues into the claims that 'greenhouse gases' are trapping heat and/or actually reflecting it, in other words the IR bounces back and forth between hard surface and troposphere, the 'greenhouse gases' act like a layer of insulation etc.
This all seems very implausible to me. In any sane world, a hot object emits IR evenly in all directions. The Consensus are also confusing cause and effect - the lower layers aren't hotter because they are absorbing and hence emitting more radiation; they are hotter anyway because of the inevitable lapse rate, so of course they emit more radiation!
The effect is actually measurable though, so it's a question of finding the actual explanation. There is no point picking holes in a flawed explanation (I wasted far too much time and mental effort on that), just start again with the basic physics (and get cause and effect the right way round!).
The actual explanation is - as ever - quite simple.
We've already established that the actual surface of Earth is not the hard surface, it is the troposphere (and the top few inches of land or ocean that are part of the troposphere for calculation purposes). The average overall temperature of the troposphere is - unsurprisingly - the same as the effective temperature' (the temperature you can calculate on the basis of the amount of solar radiation coming in adjusted for albedo, on the assumption that there is no atmosphere), which is 250-255K. The temperatures lower down are higher and the temperatures higher up are lower than the effective temperature, because of the lapse rate.
So the troposphere at sea level is 288K. This is - according to the Consensus, and I am taking their word for it - emitting twice as much radiation (half of which hits the ground) as the layer of the troposphere that is high enough to be emitting radiation directly to space (half of which actually goes to space).
You can easily work out the temperature of the layer higher up that is emitting radiation to space, and then you can work out its likely altitude.
Just divide sea level temperature (= 288K) by the fourth root of 'double' (assuming the "twice as much" figure to be reliable) (= 1.19) = 242K.
How high is that layer?
Deduct 242K from 288K (= 46K) and divide that by the expected/calculated lapse rate (between 8K/km and 10K/km, call it 9K/km for sake of argument) = 5.1 km.
The Consensus figure is "about 5 km", so we are not far off!
To try and put the numbers into perspective, I did some workings.
Step 1. Multiply up the amount of incoming solar radiation per second (in Watts/m2, i.e. Joules/second/m2) to find out the total number of Joules each m2 gets in a 12-hour day (= 20.6 million of 'em).
Step 2. Look up mass/kg and specific heat capacity (Joules/kg/1 K) for air, wet soil, and water.
Step 3. Adjust/tweak the main variables until you get 'sensible answers' in the last column. The main variables are:
a) how those 20.6 million are split between air/soil and air/water. (answer 80/20 and 20/80 respectively, partly due to albedo and partly to do with how good soil and water are at moving heat downwards or back up into the air again)
b) the height of the column of air which noticeably warms during the day (answer 800 metres*)
c) how far down from the surface the soil warms up (answer 4.5 inches)
d) how far down from the surface the oceans warm up (answer 39 inches).
The 'sensible answers' are that the soil surface/the air above it warms by 16K during the day; the ocean surface/the air above it warms by 4K during the day - which is why in the day time you tend to get onshore breezes and at night you get offshore breezes. The Earth is two-thirds covered in oceans and that averages out to 8K.
* Clearly, there's not a clear cut-off of 800 metres altitude. So for example, maybe the lowest layer above the land warms by 16K, 800 metres up it warms by 8K etc, and at 1.6 km (about 1 mile up), the air barely changes temperature from day to night. Same applies to soil and water, going downwards. If you are building a sand castle, you don't have to dig very far down before the sand is noticeably colder than at the surface. Go for a swim in the afternoon, the top few inches are pleasantly warm; stand chest deep further out and your feet get cold.
At night, the reverse happens, and the lapse rate flattens again. In extreme cases, the land cools so far and so fast that it drags down the temperature above it so far and so fast that you get a temperature inversion, i.e. warmer air over colder air, that's like a negative lapse rate.

Which is all good fun, but what is the relevance?
Firstly, that you don't need to worry about quite how or why energy/heat is absorbed, transferred or distributed (conduction, convection/down drafts, mixing or wind/currents, radiation, latent heat of evaporation/condensation). The sun sends us a certain amount of total energy and it warms stuff up, and we can reconcile/estimate how much stuff is warmed up by how many degrees K. Sometimes the obvious answers are the correct ones and need little further investigation.
Secondly, what it reminds us that is the daily variation, based on incoming solar radiation, is relatively small compared to the absolute temperature. At its coldest (just before dawn), the surface is (say) 284K and at its warmest (mid/late afternoon) it's 292K.
Which, as ever, makes me question the Consensus obsession with this chart. That particular one is gloriously mislabelled as "Earth's annual and global average energy budget". It's not! That's the global average energy budget per second! They don't even understand their own propaganda.
What the Consensus is trying to do is explain that you can and should work out how many people are in a shop by looking at how many go in or come out every second (or in their terms, the average difference between the number people going in and coming out, which must be zero anyway, hence meaningless). Sure, it gives you a guide, but you'd also have to know roughly how long each person remains in there. If ten customers enter and exit a corner shop every hour, there will only be one or two customers in there at any one time. If ten customers enter and exit a large car show room every hour, there might be about ten customers in the show room at any one time. (Ignoring the lock down rules).
The "customers entering and exiting" are like the sunshine that arrives every day, which is sufficient to warm the soil/ocean surface and the air above it by 8K on an average day; it cools down again by 8K on an average night. The infamous chart gives you no clue whatsoever as to what the baseline average temperature is ("the number of customers actually in the shop").
So why not just count the actual number of people in the shop (the baseline average minimum temperature)?
The answer to this is not particularly difficult: stuff warms up and then it cools down again. Basic physics. The smaller the surface area relative to the volume/mass, the slower it is to warm up or cool down. Warmth from the sun can't get very deep into the soil or the ocean, so for each 1 m2 of surface, there's a column of troposphere with a volume of +/- 11,000 m3, which can only lose heat to space (counting the stratosphere and higher layers as 'space') via the 1 m2 at the top.
Most of the energy (kinetic energy, potential energy or latent heat of evaporation/condensation) in the air and top bit of land and oceans (which is effectively part of the atmosphere for these purposes) is left over from the previous day; and most of what was left over from the previous day was left over from the day before that ad infinitum. Mathematically, this energy has a half life of about 24 days.
-----------------------------------------------------------------
These ramblings have now reached full circle. My guess is that the Earth's atmosphere is set up to radiate a certain % of its energy every 24 hours. The equilibrium temperature is therefore where the extra sunlight that comes in during the 12-hour day is equal to the amount lost during the subsequent 12-hour night. If Earth's surface is radiating 2.78% (relative) every 24-hours, and is receives 8K's worth (absolute) when the sun is shining on it, then the equilibrium is 8K ÷ 0.0278 = 288K. Something like that.
From the Arizona Daily Independent:
Water vapor is a powerful greenhouse gas, but its net effect in the atmosphere is to lower temperatures party because of convective heat transfer. Proponents of anthropogenic global warming (AGW) and most IPCC climate models assume the opposite (and that’s why climate model predictions diverge from reality).
AGW hypothesis: Carbon dioxide, a weak greenhouse gas, begins warming the planet. This warming evaporates water and so puts water vapor into the atmosphere which amplifies the warming effect. This is called a positive feedback.
At first look, this proposition seems logical and reasonable. But other properties of water vapor reduce temperatures and the net effect is a strong negative feedback. A positive feedback tends to destabilize a system, whereas, a negative feedback tends to keep a system in check. Just think for a minute, if water vapor had a net positive feedback effect, this planet would have had run-away global warming long ago. That alone should falsify the positive feedback hypothesis. But let’s look at some observational evidence for a negative feedback.
The graphic below compares four pairs of cities, each at about the same latitude so that each pair receives about the same amount of sunlight, and the cities are inland, away from possible tempering by sea breezes. The data is from the National Weather Service (the temperatures have been corrected for elevation differences). The difference between the pairs is that one city is in an arid climate, the other is in a humid climate. We see that the more humid city in each pair has a lower average annual temperature. The addition of water vapor to the atmosphere has a cooling effect in spite of water vapor being a greenhouse gas much more powerful than carbon dioxide.
We all accept that the actual average sea-level temperature of the Earth (288K) is about 33K higher than its 'effective temperature' i.e. what it would be if Earth had no atmosphere (255K). That's basic physics - average incoming solar radiation in W/m2 minus amount reflected as light (known figures) raises temperature of the 'surface' (as defined - see below) to whatever it needs to be to radiate the same amount of W/m2 back out to space.
The Consensus is that the entire 33K discrepancy is due to the presence of minor trace gases in the atmosphere, such as the +/- 2% water vapour or 0.04% CO2 ('greenhouse gases'). The surface converts short wave visible radiation from the Sun to longer wave infra red radiation, and this is trapped/absorbed or reflected by the 'greenhouse gases', which in turn warms up the surface even more, so it emits even more infra red in a vicious circle. Here is a typical article explaining this, which includes the energy budget diagram which doesn't add up as a bonus. Parts of that explanation are correct, parts are guesswork and assumptions, it is riddled with contradictions, leaves a lot of loose ends and unanswered questions, and overlooks some important basic physics.
Actually, if you sift out the basic physics from the guesswork and just apply the basic physics, it is quite easy to work out that the hard surface should be 45K - 50K warmer than the effective temperature. The formulas and calculations are the same whether or not there are any 'greenhouse gases', which suggest that they do not increase temperatures. As a matter of fact, there is only a 33K discrepancy, because water vapour and water in the troposphere have a moderating influence and reduce surface warming and temperature fluctuations (which accords with everyday experience and like-for-like comparisons of temperatures in humid and dry areas).
They could and should teach this as part of GCSE level physics, it wouldn't take more than two or three lessons.
A. Barry
You can easily work out that there are about 10,000 kg of air (101,325 Pascal ÷ 9.807 m/s/s) for every m2 surface. We know that 1 m2 of air at sea-level has a mass of 1.293 kg. So if atmosphere were same pressure and density all the way up, with a hard edge, it would be 7.7 km high.
You can guess intuitively that the atmosphere gets thinner as you go up and gradually tapers off into space and that there is no hard edge. So let's assume actual average density is half that at sea-level, a reasonable guess is that most of the mass of the atmosphere is up to an altitude of 15 km or so, and atmospheric pressure falls by about 7% for each km you go up, at least for the first five or ten km (which is not far off actual measurements).
If you want to calculate this properly, you use the Barometric Formula (or 'Barry', as I affectionately call it) which is based on actual ideal gas laws and gives you reasonably accurate predictions for pressures at different altitude, at least for the troposphere (which is all we really care about, i.e. is the bottom 11 km, others say bottom 13 km, it's thicker at Equator and thinner at the Poles). The formula is very clever. I can just about understand how they work it out, but I would struggle to reverse engineer it or explain how to derive it.
B. The lapse rate
In an intuitive way, you can also guess that the temperature at the top of the atmosphere is close to the temperature of the nearly empty vacuum of space, which is either close to 0K or has no measurable temperature at all, depending on your point of view. So temperature falls the higher you go, as anybody who has been up a mountain knows.
Remember that 'energy cannot be created or destroyed, it merely changes from one form to another'. Air at sea level as thermal energy (aka kinetic energy) and no potential energy (it can't fall any further down). Air higher up has the same amount of total energy - less kinetic energy and some potential energy. It is reasonable to expect the total amount of energy to be the same at different altitudes.
Once you accept this, you can work out the lapse rate. I'll show you how, just for fun and because it is important:
Potential energy in Joules = mass x gravity x height.
So J = m x g x h
Joules required to increase temperature of 1 kg of a substance by 1K = specific heat capacity ('cp' ) of that substance.
So T = J ÷ (m x cp)
We can simplify/merge those two equations as follows: T = (m x g x h)/(m x cp); cancel 'm' top and bottom; T = g x h/cp; divide both sides by h; T/h = g/cp.
(Thanks to Tallbloke for this short-cut - Wiki gives an explanation which is almost impenetrable to the layman, although it ends with exactly the same formula)
1 kg of air which is 1,000 metres higher up has got 9,807 more Joules of potential energy than 1 kg 1,000 metres lower down, so the air lower down must have 9,807 more Joules of kinetic energy (and vice versa).
How much warmer is the air 1,000 metres lower down?
Specific heat capacity of air = 1,006 J used/needed to increase 1 kg of material by 1K
T/1,000 = 9.807/1,006
T/km = 9.75K
Hence the predicted lapse rate = 9.75 K/km altitude.
[I think it makes more sense to a) use the specific heat capacity for constant volume rather than constant pressure, and b) to calculate J/m3 rather than J/kg. That means first using Barry to find pressure, at different altitudes and then finding the temperatures which balances Joules of kinetic energy and Joules of potential energy (basing calculations on density at different altitudes, not on pressure, so you need to know pressure and temperature to work out density, and the temperature is the thing you are looking for!), which is why the lapse rate I worked out was 8K/km. I'm not sure if my logic on a) and b) is 100% sound, but my method gives an answer which is closer to the real world observed typical rate of 6.5 K/km, so I'm happy with my method for now.]
C. What is the surface of the Earth?
The Consensus give a nod to Barry and the main reason for the lapse rate. They don't deny they exist, they give the formulas but then downplay them as irrelevances and draw no conclusions from them. It's like the road sign saying turn left and the sat nav saying turn left, but turning right anyway. It's all about radiation from the surface being reflected back down by those dastardly 'greenhouse gases'! Any other explanation is heresy!
The Consensus' most heinous and borderline criminal obfuscation is in their definition of the 'surface'. They define 'the surface' as the hard surface at sea level, or the surface of the oceans (two-thirds of Earth's surface is ocean).
Here are a few reasons why that is wrong:
1. If you calculate the 'effective temperature', you should also be looking at 'effective surface', which is whatever the sun light hits first, Earth has a lot of clouds, so the 'effective surface' is NOT at sea-level.
2. If you approach Earth at speed from space, you feel it when you hit the atmosphere. That is the real surface.
3. If you scale down the earth to the size of a football, the troposphere is only 0.2 mm thick. You think it's thick when you look up at an airliner, but it's only 11 km away, you could drive that far in a few minutes.
4. There are about 10,000 kg of air (mass) for every m2 surface (see above)
5. The sun only warms the top few inches of the hard surface (or water), that's a few kg of mass per m2. So if the atmosphere is 0.2 mm thick, the hard surface or sea-level is barely a couple of molecules thick.
6. When we talk about the surface of the ocean, we mean the top of the water, not the hard surface at the bottom.
7. When we talk about the surface of the Sun or a Gas Giant, we mean the surface of the atmosphere, not the hard surface lower down (to the extent there even is one). Why do we change the rules when looking at rocky planets with thinner atmospheres?
8. As far as heat distribution goes, we might as well treat the top few inches of the hard surface as the bottom part of the troposphere. It's usually the same temperature, and must be the same pressure.
Therefore, the real surface is the whole troposphere, not the hard surface or the surface of the oceans.
Summary
The troposphere is the surface, and as a whole and on average, is the temperature you would expect from incoming solar radiation = +/- 255K. This is what you would expect, and this is what you get. I don't see why anybody taking this view should be on the defensive in a discussion. It is those trying to say otherwise who are struggling.
The troposphere itself, it is not a constant 255K. There has to be - and there is - a lapse rate. There are different ways of calculating/predicting it, and it can be observed/measured, so it's about 33K warmer than 255K at the bottom (the hard surface); it's about 255K half-way up (as defined); and it's about 33K cooler than 255K at the top of the troposphere.
Bonus
This A-B-C easy GCSE-level approach also explains a lot of things which the Consensus explanation can't and doesn't (and by and large, just glosses over to save embarrassment), for example:
1. Why the top of the troposphere (or the peak of a very high mountain) is colder than the 'effective' temperature, i.e. colder than it would be if Earth had no atmosphere.
2. Why the day/night temperature range on Earth (+/- 15K) is so much smaller than the day/night temperature range on the Moon (+/- 300K).
3. Why, despite the 'greenhouse effect', Earth's day-time temperatures at the surface are lower than what they would be without an atmosphere.
4. Why the 'greenhouse effect' is much stronger at night (i.e. actual temperature minus expected temperature of the night side of Earth if it had no atmosphere) than in the day time (when the Sun is blazing down on us and there is plenty of radiation sloshing about).
5. Why 'heat rises' is a truism only observed in enclosed spaces kept above the temperature of their surroundings (central heating in buildings; actual greenhouses/polytunnels) and why convection doesn't actually transfer heat upwards. For sure, there are thermals above hot surfaces (like square miles of dark tarmac at airports, which can make landing trickier than it need be on hot days), but for every molecule that goes up, one has to come down. One molecule converts kinetic energy to potential energy and the one coming down does exactly the opposite.
6. Why there is no need to get tied in knots over which methods energy (in its various forms - visible and infra red, kinetic energy, potential energy, latent heat of evaporation/condensation etc) is distributed in the troposphere (conduction, convection or radiation). All you need to know is that energy tries to distribute itself as evenly as possible (governed by the physical laws discussed here, or by winds/weather, if you want an everyday term for a complicated process).
7. Why the troposphere emits twice as much radiation towards the ground than it does out into space. This cannot be satisfactorily explained by 'greenhouse gases trapping and/or reflecting heat', it is because the troposphere at sea level is warmer and hence emits more radiation that the layer higher up, which is colder and so emits less radiation, see here.
8. Why water can't be a 'greenhouse gas', although this is based on observation rather than physics, which is really complicated with water vapour and water (see here).
9a. Why it is irrelevant that N2 or O2 are transparent to, and cannot absorb or emit infra red (even if this were true, which is questionable). They can certainly warm up, and they in turn keep the hard surface at the same temperature. So even if N2 and O2 aren't emitting infra red themselves, the hard surface converts that warmth back to radiation anyway. The total infra red leaving the hard surface is the same whether it is bouncing back and forth as infra red between hard surface and troposphere (the Consensus), or whether the hard surface has to convert kinetic energy from N2 and O2 back into infra red first (the actual explanation).
9b. Why, even if the troposphere were indeed completely transparent to and unaffected by infra red radiation, incapable of absorbing or emitting it, the temperature at the hard surface would be the same as it is now. The hard surface would quickly reach 255K (accepted by the Consensus) and it would warm up the troposphere by conduction and convection until the whole troposphere (the effective surface) were 255K on average (it being incapable of radiating heat to space, that's the Consensus). That 255K would be the average, there would still be a lapse rate and so the temperature of the hard surface would increase to 288K (and the top of the troposphere would be about +/- 222K). The hard surface would then be warm enough to emit the required amount of infra red straight through the troposphere and back into space (not being able to lose any more energy to the troposphere by conduction or convection).
10. Why there is a lapse rate on all planets with an atmosphere, even Gas Giants (Jupiter, Saturn), which have no hard surface (and if they do, radiation from the Sun never gets there) and which consist mainly of 'non-greenhouse gases' (mainly hydrogen and helium); why they are insanely hot at their centres; and why those Gas Giants are actually emitting more radiation to space than they get from the Sun.
11. Why the 'greenhouse effect' on Mars is barely measurable (max 5K), even though there is twenty-five times as much CO2/m2 surface area as there is on Earth.
12. Why you can predict Venus' hard-surface temperature fairly accurately using the same basic physics (here). All you need to know is distance from Sun and albedo, from which you work out 'effective temperature'; the height of 'effective surface'; the acceleration duty to gravity and specific heat capacity of the gases in the atmosphere, from which you work out the lapse rate up- and downwards. Whether or not the constituent gases are 'greenhouse gases' is entirely irrelevant. Knowing the mass of constituent gases in kg/m2 helps as well for cross checking.

