Data from the ONS.

By that metric, we're not quite at undershoot yet, but pretty close. The BBC reckons we are, by a slightly different metric.


Shorter Jason Okundaye: 'Stop Noticing! '
14 hours ago

Data from the ONS.
By that metric, we're not quite at undershoot yet, but pretty close. The BBC reckons we are, by a slightly different metric.
From The Evening Standard:
Asked during a London Assembly investigation into coronavirus for the most likely sources of future outbreaks in the capital, Professor Fenton, the London director of Public Health England, said vigilance was needed in hospitals, care homes and people returning to the UK after foreign travel.
But he highlighted food factories as an “emerging area” of concern because of the proximity of workers to each other and the low pay, meaning staff were unlikely to be able to afford to self-isolate at home if they fell sick.
Outbreaks have been seen in food factories in Wales and Yorkshire, and in Germany, France, Spain and the US.
Interesting, the link is quite striking.
Prof Fenton thinks that the type of people who work there are the common denominator (see also - care home workers). Last month, Sky News quoted an expert who thought it was a combination of close proximity of workers and the fact that these places are kept so cold (not good for immune system).
The other possible link is the animals and meat themselves, as these outbreaks don't seem to happen in other frozen food factories. Which would sort of prove the militant vegetarians right. Oo-er.
Dinero, in the comments here:
"It occurs to me that VAT has a monopoly profit tax element to it. [In that it taxes the profit margin on a transaction rather than the profit of the balance sheet aggregate turnover]. I was thinking of the word monopoly in that where a vendor sells something unique and in demand, without competition then that vendor can successfully pursue a high profit margin.
Ignore the sentence in square brackets, which betray a deep misunderstanding of basic bookkeeping and economic concepts.
VAT does precisely the opposite! It doesn't tax the profit margin and helps the monopolist.
-------------------------------
Consider our monopolist, who is insulated from market forces (by some combination of economies of scale, barriers to entry, customer loyalty, patents etc). He pays his workers £50 per unit and sells them for £100 incl. VAT. The UK VAT is one-sixth of the selling price, so he pays £16.67 VAT and has a net profit of £33.33 per unit, or 33.33% of the selling price.
Our new entrant or challenger, subject to competition pays his workers £50 per unit and sells them for £70 incl. VAT. He pays £11.67 VAT and has a net profit of £8.33, just under 12% of turnover.
-------------------------------
If the unit selling price is squeezed by a £5 and costs go up by £5, the monopolist's profit per unit is still £20, or 21% of the selling price. The little guy still has to pay £10 VAT and ends up with a net loss of £5 per unit.
So the little guy goes out of business and his ex-workers are all looking for work. The monopolist survives and can push up the selling price to £100 again and push down wages to £50.
------------------------------
In our first scenario, the two businesses had pre-tax profits of £70 and tax man collected £28.33 in VAT.
What's the position if the tax man scrapped VAT and imposed 40.5% corporation tax instead (£28.33 ÷ £70 gross profits)?
The monopolist pays £20.23 corporation tax on £50 gross profit (more than he paid in VAT) and the little guy pays £8.10 corporation tax on £20 gross profit (less than he paid in VAT). That's a good start.
If selling prices drop by £5 and wage costs go up by £5, the little guy's after tax profits fall to £5.95 per unit, so he still making a living. The monopolist is still doing very well. We end up with more new entrants and challengers; lower unit prices for consumers; more employment; and higher wages.
What's not to like?
Physiocrat, here, is very radical on this:
VAT costs and losses
1) Admin - not very much as the costs are transferred to business.
2) Churning - VAT is part of the price index to which pensions, benefits and public sector pay are linked. This makes it a major government cost in its own right.
3) Abstraction from other taxable revenue streams.
4) Welfare costs arising from deadweight losses.
5) Tax revenue losses due to deadweight losses (separate from abstraction).
My piece on the LVTC web site needs to be re-worked with better calculations. I would not be surprised if, because of the above, the Exchequer is out of pocket due to VAT.
I think he's overselling it. We exchanged emails this afternoon, and my summary is this, FWIW. Total VAT receipts are about £130 billion a year in the UK. What happens if we scrap it (which we can now do, post-Brexit) and make no other changes to the tax system?
1) Admin costs
Government HMRC admin costs are supposedly around 1% = £1 bn, double that for 'carousel fraud' etc = £2 bn.
Number of VAT registered businesses (two million) x extra work each quarter adding the extra info to the accounting system and doing the quarterly VAT return (ten hours) x average hourly cost of employing a bookkeeper £50 (wages, NIC, desk space) or lost value of small business owners' time when they could be actually producing something = £4 billion a year. Smallish number, so let's include it with dead weight costs at 5) below.
2) Churning
I'm not sure I agree that "VAT is part of the price index to which pensions, benefits and public sector pay are linked". VAT has little impact on end prices, Phys countered that "End prices would go down if all these people were not handed government money to pay VAT with!" which is true. I'm still not sure what the net impact on government spending would be.
3) Abstraction from other taxable revenue streams
This is the biggest and easiest number.
PAYE (income tax plus two layers of NIC) on average worker = 40%. Higher rate employees PAYE = 49%. Corporation tax is 19%. If profits are paid out as dividends to individuals, there's a bit more income tax on that. VAT cuts into business rents, which are taxed at about 40% via Business Rates. The overall average rate is (say) 33%, so one-third x £130 billion would come back in anyway = £43 billion, assuming no change at all to selling prices and output in real terms (goods and services supplied, hours worked etc).
5) Tax revenue losses due to deadweight losses (separate from abstraction) and 4) Welfare costs arising from deadweight losses
Let's say scrapping VAT boosts the economy and trade by 5% in real terms (low guess - it depends what assumptions you make about price elasticity of supply and demand). Total current tax revenues from economic activity (PAYE income tax and NIC, corporation tax, bank levy, Business Rates etc) about £430 billion a year. 5% of that = £21 billion.
There are about thirty million employees. Let's say that number also goes up by 5% and 1.5 million who are currently un- or underemployed get a part-time job, longer hours, full time jobs. Average unemployment benefit, housing benefit etc (say) £10,000 per person per year = £15 billion saving.
Summary
HRMC would lose £130 billion of VAT receipts.
HMRC would save £2 bn admin costs and fraud; get £43 bn more from other taxes anyway (static basis); get another £21 bn from other taxes from losing deadweight costs (dynamic effect); and the DWP would save £15 bn a year in welfare payments, total £81 billion.
That means that the UK government would only lose about £50 billion a year if it scrapped VAT outright.
For convenience and to make this politically sellable, we can play along with the myth that consumers/households pay the VAT.
£130 billion divided by 29 million households = £4,500 per household on average. If we claw back the £50 bn shortfall from total housing values (pre-lockdown) of over £7 trillion, it would require a progressive property tax of about 0.7% on selling prices (or for the purists, a 25% Land Value Tax on residential site premiums) = £1,750 on average.
The average household is £2,750 a year better off. What's not to like?
My daughter, who is in her first year of doing A-levels came up with this plan, which I thought was pretty good:
1. Schools and universities all start again in September with the syllabus they were supposed to cover in the summer term.
2. Pupils and students who should have taken exams this summer just take them in December instead, when everything is hopefully nearly back to normal.
3. The academic year now ends in December with a few weeks off for Xmas and New Year before the next academic year starts. Hooray, lazing around and partying without anything to revise and no homework to do!
4. Bonus #1 is that people will get real GSCEs or A-Levels in December 2020, instead of notional GSCEs or A-Levels awarded by their teachers. Surely a real B grade is better than a notional A grade?
5. Bonus #2 is that the anachronistic and nonsensically long summer holiday would be a thing of the past, each school just pencils in a few shorter holidays of two or three weeks* scattered through the year, which would reduce the price differential between 'summer season' and 'rest of year'.
* So they can have holidays to coincide with European Cup, World Cup, Olympics, Wimbledon (for the posh schools) etc and kids and teachers can enjoy them in full. A level pupils get a few weeks off during festival season. And so on.
From The Scotsman:
Helpfully, the former Edinburgh SNP MSP and local government minister Marco Biagi has done some sums, calculating that rolling in all benefits currently paid out in Scotland would cover £19bn and on the basis that the Scottish Government won’t stop spending £19bn on schools, hospitals, police and all the other services for which it is directly responsible, the rest of it would have to come from higher tax, almost all on income.
It doesn’t sound too bad when you say it quickly enough; a bit more income tax and everyone gets £9,000 a year with no strings attached. The rich can easily afford it, so what’s not to like?
What’s not to like is the scale of the tax rise. Most appraisals of CBI presume the £12,500 tax-free personal allowance would go and National Insurance would be paid by everyone, and Mr Biagi’s calculations produce a basic income tax rate of between 42 and 44 per cent.
The Office for National Statistics estimates average gross earnings in Scotland to be £470 a week, £25,000 a year give or take a quid or two, and income tax at 40 per cent would mean the average worker paying £10,000 a year in tax and getting £9,000 in return.
He appears to be suggesting that UBI is bad for two reasons:
1. It would increase basic rate of income tax to 40%, and
2. The net cost of income tax minus UBI to an average taxpayer would be £1,000 a year.
The problem is, he is a fucking moron who doesn't know what he is talking about and isn't comparing like with like.
1. At present, the total marginal withdrawal rate (PAYE deducted plus means-tested benefits foregone) for an average earner is at least 75%. They might not know it, but it is. £9,000 a year is a very generous* UBI, so I hope it would replace all means tested benefits, in which case the effective withdrawal rate is reduced to the new higher PAYE rate of about 55%**, which is a big improvement. You end up 45p better off for every £1 you earn, not 25p.
2. The current net cost of income tax minus UBI to an average [Scottish] taxpayer is £2,480. They pay £2,480 income tax and receive £zero UBI. So reducing that net cost to £1,000 is a big improvement.
* I would say overly generous, but hey, I'm using other people's figures.
** Basic rate tax and NIC are bad taxes, but not the worst. That's VAT, and in this context, means-testing.
The myth is that VAT is a relatively benign tax because it is a "tax on consumption". Anybody who knows anything about tax incidence and bothers to look at actual statistics on what happens to prices, output levels and profits or wages when VAT rates change; or price differences in the USA where each state has different Sales Taxes knows that this is nonsense.
Value Added Tax is the worst of both worlds, it acts like a tariff, so dampens economic activity and is also, quite literally a tax on "value added" i.e. wages and earned profits. It's a crude profits tax that is payable even if a business isn't actually profitable (but would be if there were no VAT).
In the UK, businesses pay about three times as much VAT as they do corporation tax, so surely, if you interested in the tax system, you focus on VAT. But all the attention is directed at corporation tax. There are loads of headlines that Starbucks or Apple (or whoever) pay little or no corporation tax in the UK, which is quite probably true. But they still hand over £ billions in VAT.
So far so bad.
------------------------------------------------------
Mombers spotted this at Bloomberg:
There’s a new bad idea doing the rounds in Europe. Many governments are convinced that a reduction in value-added tax will help relaunch their economies. Some, including Germany, have already wielded the ax. Others, such as Italy and the U.K., are taking this option seriously.
But the benefits of cutting VAT are limited, and the costs are large.
Reducing VAT from 20% to 17.5% was the best thing that Alastair Darling could have done back in 2009. He did it and it worked i.e. softened the impact of the financial recession. The benefit was measurable and large and far from 'limited'.
As with any other tax cut, the key question is who gains from it. The answer for VAT depends on a concept economists call “incidence,” which refers to how the tax burden or benefit is shared between companies and consumers. In the case of VAT, retailers can either pass on any reduction to shoppers by lowering their prices or they can keep their prices unchanged and pocket the difference.
Unfortunately, research shows they’re more likely to do the the latter, which wouldn’t be much use for any policymaker looking to use such cuts as a way of fostering a consumer-led recovery... They looked at a large cut (from 19.6% to 5.5%) for sit-down restaurants in France in 2009, after the financial crisis.
The results showed that consumers weren’t the chief beneficiaries of the reduction. It was the restaurant owners. The price of a restaurant meal decreased by a mere 1.4% in the month after the steep VAT cut, and it didn’t fall much further over the next two and a half years. The two researchers showed that restaurant owners pocketed 41% of the economic gain from the VAT reduction, while consumers got 19%. Restaurant staff obtained 25% in the form of higher wages, and suppliers accounted for the rest.
This is of course exactly what you'd expect to happen (it has been observed countless times). There was plenty of evidence ten years ago that this is what happened, it is hardly a new insight. What they don't mention is that output increased (a lot more people visited restaurants, even though prices had only dropped a bit).
So, having made the false assumption that VAT is a benign tax because consumers pay it, they argue that VAT cuts are bad because consumers don't pay it? The article then goes on to say that VAT increases are bad because consumers do pay it! Do they not realise that they are contradicting themselves at least twice over? Is there such a thing as TrebleThink? Everybody's entitled to be wrong, but at least be consistent!
As to "fostering a consumer-led recovery", people can't consume more unless somebody else is producing more. And do they not realise that restaurant owners, restaurant staff and restaurant suppliers (and their employees) are all consumers too? If they have more money to spend, they will probably spend it.
Hat tip - Brian, follower of Deornoth, who spotted this at Twisted Sifter.
These words were spoken, through a just alight dog end stuck to his bottom lip, by a labourer in a potato merchant to a friend of mine who was his foreman and was trying to hurry him up in loading the lorries. The message is don't work too hard or fast or the job will go.
But what really kills jobs?
We all know that jobs are a cost of production, not a benefit hence the costlier you make it to employ somebody the less jobs there will be.
Which brings me on to this (which I have just re-discovered):
It seems to me that the other takeaway from Fred's analysis is that by taxing labour not land you kill production which in turn kills jobs. Or rather the killing of jobs kills production.
Of course it gets worse. The value of money arises from production. Fiat money is what it says it is. Its value does not arise from production. So without production (and yes that would include house building) money must eventually have no value.
So on top of reducing production we now have money printing to save production...
It's not going to end well is it.
Unless we change course...
Cow attacks? Those crazy Texans have gone one better. From Bossip:
Hollywood Park Mayor William “Bill” Bohlke was killed by his 500-pound donkey in an apparent attack Monday, said Chief Deputy David Soward of the Atascosa County Sheriff’s Office. Soward said the donkey remains on the ranch and an exact cause of death is pending.
“They [donkeys] can become very aggressive, very mean, sometimes triggered by a female in heat,” Soward told the San Antonio Express-News. “We’ll probably never know what triggered it, but it was evident that this particular donkey was involved, based on the evidence at the scene and what we saw on this donkey.”
Well nearly, but she's done some proper homework. From The Guardian:
News of the government’s plans surfaced, as they always do these days, in a private briefing – that the chancellor, Rishi Sunak, plans to slash VAT, in an emergency measure to stimulate spending and boost the post-Covid economy, from 20% to 17%.
Which is much to be welcomed, sales or turnover taxes are the worst kind of tax; VAT is very literally a tax on "value added" (wages and business' earned profits), not some harmless tax on "consumption".
The EU, over time, set a minimum level of 15%, except in special circumstances – which, considering sales tax was previously set at 10%, even by a Conservative administration in 1973, made the EU the driver of an essentially anti-progressive policy. It’s a useful, if tangential thing to remember, for the despairing remainer: the EU wasn’t perfect.
Which was one of the main reasons I voted Leave.
Yet in special circumstances, an individual nation could insist on a lower rate for VAT: Alistair Darling didn’t need to, following the financial crisis in 2008, since he just wanted to reduce the rate from 17.5% to the minimum 15%.
You really had to be there to remember the ridicule this generated. It was piecemeal, it was pathetic, yet at the same time it was crazily expensive and horrifyingly risky. It was the act of a chancellor who didn’t know how much trouble the nation was in, but also one who panicked and couldn’t keep his head.
I remember nothing of the sort. Darling said he'd reduce it for 13 months. I cheered at the time, and this was one of two tax-tweaks which softened the blow of the 2008-09 financial recession. The other was reducing the number and generosity of Business Rates exemptions for vacant premises. The Tories got in and increased the rate again after the 13 months were over (the idiots).
In 2009, the Institute for Fiscal Studies, among many others, judged [Darling's VAT cut] to have been a significant success..."
As well they might, because it was. With VAT you can hardly go wrong if you're reducing it.
The same people who ridiculed Darling will now be praising Sunak as a visionary.
And you, Zoë, are praising Darling while slagging off Sunak for doing a similar thing. That's what the media do. They're cheerleaders for one side or the other. It's about as enlightening as listening to football fans arguing about why they support different teams, which are basically all the same.
VAT in its early years was a manifest statement of political intent: Labour chancellors kept the base rate very low, then went wild with the luxury rate (Denis Healey at one point had the higher rate at 25%). Conservative chancellors would then come in and “harmonise”, and this was a classic framing triumph: who could possibly disagree with bringing harmony?
Yet, of course, it meant saddling the general population with a tax that was previously weighted for the broad-shouldered.
This is only correct if you assume that VAT is borne by the consumer, which it isn't (unless demand for something is price inelastic, like booze, fags, fuel). The real damage that VAT does is acting like a domestic tariff and hence a huge brake on the economy.
VAT puts (or keeps) businesses out of business and puts (or keeps) people out of work. The unemployed probably don't pay much VAT, but half of them are unemployed simply because of VAT.
"You Georgists just hate landlords!" and "You Georgists are just envious of people with big back gardens!"
The latter is nonsense, we do have a big back garden (by London standards - pretty average for old houses in England), as do many other Georgists I know. Some are tenants, some are even landlords, that does not colour our opinion much.
As to landlords, would you say that the people at IBM who developed the word processor hated typists and type-setters? Are the people who design and build tractors envious of farm labourers? Did James Hargreaves invent the Spinning Jenny to spite people who span fabrics at home?
Nope, they just invented better ways of doing things that were to the overall benefit of humankind. With every step forward, there are people who lose out and have to find a different way of earning a living.
It's the same with tax reform. Government spending which enhances land values (however indirectly) should be funded out of a user charge on the land values arising, and all the regressive and damaging taxes should be reduced as far as possible. If car manufacturer spends money on improving their cars, they get their money back by selling them for higher prices or selling more of them. What's wrong with customer paying more for better product - should those enhancements be paid for out of taxes on the general population, car owner or not?
And if reliability improves, the car repair workshops lose out. So what? That is still to the overall benefit of humankind.
And yes, there are people who have arbitraged or gained from our current unfair and stupid tax/land ownership system who will lose out, the same as the typists, typesetters, farm labourers and weavers lost out in the past.
That's not an argument for sticking with typewriters and type setting; we could argue against those and say we should have stuck with hand writing, but to preserve the jobs of monks, the hoi polloi shouldn't be taught to read and write either, the ultimate logic being we should have stayed living in caves and hunting animals with stones.
And it's not an argument for funding landowner benefits out of taxes on the general population, landowner or not, either.
Mike W spotted a rather strange Q&A in The Guardian, and added "If I make an offer and you accept, I always assumed that was 'market value'. Indeed, 'marked to market' surely? What the hell do they mean here?"
The mortgage adviser replies: "However, not all lenders are prepared to lend to people buying property at less than market value."
Which really is baffling. You'd expect lenders to be paranoid about lending on homes bought for more than market value, but not the other way round.
---------------------------------------------------
On the subject of "below market value", I was chatting to somebody who lives up the road who nearly got a massive sitting tenant's discount when they bought the house they had been renting for four years. Unfortunately, the owner's ex-wife got wind of what they'd shaken hands on and slashed the sitting tenant's discount by about half (they still got a fairly good deal).
I told him that we got the full sitting tenant's discount, we'd been paying rent for six years, and the owners wanted to sell. To my amazement, they accepted our cheeky offer, which was effectively the easily achievable selling price* minus five or six years' rent.
* If they'd put in another £10,000 or £20,000 to smarten the whole house and garden up a bit (all the stuff we've been doing ourselves for the last six years), they could have sold it for a lot more than that, but (thankfully) they couldn't be bothered.
Is there a pattern emerging here..?
From the BBC: Many experts think Covid-19 likely originated in the Huanan Seafood Wholesale Market in Wuhan, which has been linked to early confirmed cases. While not a wet market in the strictest sense, reports suggest the market was selling wildlife, including snakes, porcupine and deer.
BBC 13 June: Chinese officials aren't sure how the huge Xinfandi wholesale market - which supplies 80% of Beijing's vegetables and meat - has become the source of a new coronavirus outbreak.
BBC 17 June: Thousands of people in Germany have been told to go into quarantine after a coronavirus outbreak at an abattoir. More than 650 people have tested positive for the virus at the meat processing plant in Gütersloh, in the north-west of the country.
BBC 19 June: A coronavirus outbreak at a meat factory was shrouded in "secrecy", it has been claimed. Health Secretary Matt Hancock revealed at Thursday's daily briefing there had been cases in Kirklees, West Yorkshire.
BBC 19 June: Schools in Anglesey will not reopen as planned, after an outbreak of coronavirus at a meat processing factory. All staff at the 2 Sisters chicken factory, in Llangefni are self-isolating after 61 workers tested positive.
Sky News gives a possible explanation:
People working in refrigerated environments in food factories could be at a higher risk of contracting coronavirus, a microbiologist has told Sky News...Dr Simon Clarke, a microbiologist at the University of Reading, told Sky News: "There are two possible explanations. The first one is that people aren't observing proper distancing and working together. But then if that were the case, why would you see it only in food processing plants and not other factories?"
"I think a more likely explanation may well be the cold - these places tend to be refrigerated. If these places are refrigerated, do you get an increased susceptibility to infection like you get during the winter with the cold? The truth is, we don't really know. But my suspicion is it's got something to do with the cold, refrigerated environment in food factories."
Yeah but no but. I don't think that the Chinese wholesale/wet markets are refrigerated, and I'm not aware of any outbreaks in frozen vegetable or ice cream factories, so the common link is the animals, living and dead. There was also an outbreak in a factory in Wrexham that makes ready meals so I assume that meat involved.
It turns out that far greater and better qualified minds than mine have been pointing out the real (and blindingly obvious) reason for The Greenhouse Effect since the late 19th century, all to no avail. So it's not like I can make any difference and I'll just do one final blog post (I gave this a lot of thought while painting our kitchen cabinet doors last week but was too knackered to post anything) and call it a day.
A good place to start is at Tallbloke's Blog. Some of the modern day proponents are moderate and sensible, others seem to be a bit unpleasant and/or borderline mad. Take your pick, but that doesn't invalidate the explanation. Isaac Newton was a towering maths and science genius, but an unpleasant person to deal with and he also believed in transmutation of elements. So what?
All proponents have a slightly different way of explaining it, but it is of general application and explains so much that the Alleged Greenhouse Effect doesn't and can't. Suffice to say, the Consensus derides them all as crackpots and/or Science Deniers.
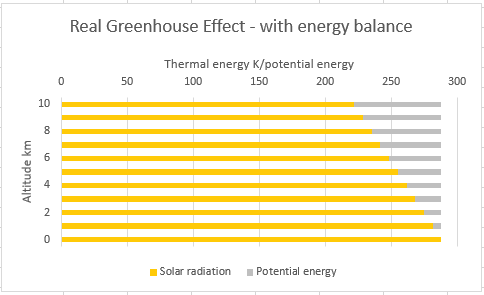
What it boils down can be illustrated for Earth's atmosphere as follows. The total energy (thermal plus potential) of any molecule at every altitude tends to equalise. Clearly, you don't measure potential energy in degrees K, you measure it in Joules, but they are of equivalent value. (Like somebody running a hydro-electric power station makes a trade off between "water up in the reservoir" and "kilowatt hours of electricity". There is a trade off between kg's and kWh's and they add up to the same total energy value, ignoring conversion losses/inefficiency):
That's my new flag! Fuller explanation (and the planned introductory chapters) as follows:
1. 'Energy' is just 'energy' and it takes on, or can be stored in, different forms, such as
- photons/radiation,
- kinetic energy (on large scale) or thermal energy (kinetic energy on a molecular scale),
- potential energy (height x gravity),
- latent heat of evaporation.
Those are the main ones we need to think about in terms of the atmosphere. There are others such as
- chemical energy,
- electrical energy,
- matter (which can be converted back to energy in nuclear fusion or fission)
but these are not so relevant here.
2. Energy can be converted from one form to another without overall losses. For sure, with plants and animals, or engineering, in any process some of your starting energy is converted to forms you didn't want or can't use, but that doesn't apply when energy in the atmosphere swaps between thermal energy and potential energy (convection) or back again, and this process is to all intents and purposes 100% efficient.
A good example of this two-way conversion is using spare/cheap electricity at night to pump water up into reservoirs (electrical energy is converted to potential energy). Then at times of peak demand, the sluice gates are opened, the water goes through turbines and generates electricity (potential energy is converted back to electrical energy). (Clearly this is not 100% efficient, in that some energy is lost to evaporation, vibration, heat/friction, sparks etc.)
Similarly, if you throw a ball vertically, it starts off with a lot of kinetic energy (it's moving fast); it then slows down and gains height (kinetic energy is converted to potential energy); it reaches a point where it is momentarily stationary (zero kinetic energy, maximum potential energy); on the way down, the reverse happens. Ignoring air resistance, the total energy of the ball remains constant. Analogies are never perfect, but this is similar to what happens in the atmosphere.
3. There are names for the processes when energy changes (or is converted) from one form to another.
Objects warm up when bright lights shine on them. When a warm object cools down, it 'radiates'.
We 'generate' electricity by converting thermal energy, solar radiation or kinetic energy into electricity. We 'use' electricity to create heat, light or movement.
When plants convert solar radiation to chemical energy, it is called 'photosynthesis'. We 'burn' things with stored chemical energy (wood) to create thermal energy and light.
When water evaporates, some of the thermal energy needed does not increase the temperature of the water directly. It is 'used' to convert water from liquid to gas and is stored by the water vapour as 'latent heat of evaporation'. So the land from which the water evaporates cools down by more than the water warms up, if you just measure it with a thermometer. This energy does not disappear (of course), it is just a different form of energy. When the water vapour condenses, it releases that latent heat as actual heat again (which is mainly why the observed lapse rate is only two-thirds of the predicted dry lapse rate).
I don't know if there is a word for kinetic energy being converted to potential energy (and back) when you throw up a ball (and it falls again).
When air is warmer than it surroundings, it expands, rises and cools ('convection') and thermal energy (kinetic energy on a molecular scale) is converted to potential energy (similar to a ball thrown upwards). For every bit of warm air that rises, another bit somewhere else falls down, is compressed and warms up, so the potential energy it had is converted to thermal energy again. Unfortunately there is no word for the opposite of 'convection'.
The meteorologists refer to the potential temperature of air. Although they are interested in unstable situations (because that's what makes the weather happen), it is the same sort of concept. The potential temperature is the temperature that the parcel of air would be if it were brought down to sea level atmospheric pressure. So it dry air at sea level is 288K, dry air which is 1 km above sea level and has an actual temperature of 278K also has a potential temperature of 288K and the two are in a neutral equilibrium.
It would be very helpful to split the potential temperature into a) actual temperature and b) the 'latent heat of convection' analogous to 'latent heat of evaporation' (or the 'latent speed' of a stationary ball at the top of its flight), because just like the 'latent heat of evaporation', which reappears as actual thermal energy when water vapour condenses, the 'latent heat of convection' (which cannot be measured with a thermometer) turns into actual thermal energy when air falls again.
For our purposes, we don't actually need to worry about whether energy in the atmosphere is transferred by conduction, convection, radiation, latent heat or anything else - the final distribution or equilibrium will be the same in the long run.
We also don't need to worry about how the energy gets into the atmosphere in the first place, which is mainly by solar radiation hitting the hard surface, the ocean surface or the clouds (occasionally it's a volcanic eruption or a meteor hitting it), because that doesn't affect the final distribution. That would be like assuming that the surface height of a lake depends on which ends is being rained on; or that a bath warms up more at the end where you pour in a bucket of hot water.
4. Energy tries to spread out as evenly as possible.
This is easy if we are just looking at one type. If rain falls at on end of a long lake, the water level in the whole lake rises by the same amount, or else the surface at the rainy end would be higher and have more potential energy than the sunny end. If you pour a bucket of hot water into one end of a lukewarm bath and wait for a few minutes, the temperature of the whole bath will go up by the same amount.
But in the atmosphere, potential energy can't be the same all the way up. This is the key to the whole thing. The top layer will always have the most potential energy and the bottom layer will have none. So energy does the next best thing and adjusts temperature so that the total energy (thermal plus potential) of any molecule at any altitude tends to equalise, which it is why it is so easy to understand the formula for the lapse rate (gravity ÷ specific heat capacity), it's just the trade off between the two forms of energy (on Earth, we have to adjust this down by one-third because of the latent heat of evaporation/condensation of water/vapour).
Rather unsurprisingly, because the average temperature of the atmosphere is 99.9% dictated by incoming solar radiation, the average temperature of the whole atmosphere is what you would expect it to be from that incoming solar radiation (i.e. 255 degrees K, the 'effective temperature'), but this thermal energy is not distributed evenly all the way up; there is more at sea level (288 K) and less at the top of the troposphere (213 K) - see chart above.
5. The normal gas laws have to be modified over large scales where gravity is relevant
The normal gas laws apply on a small scale in a sealed container (where you can safely ignore gravity) and tell us that temperature, pressure and density will all even out. But this does not apply on the large vertical scale in the atmosphere where gravity is important and where there are no sidewalls (a molecule that moves sideways hits another molecule, it never hits a wall) or lid (unless you count gravity as a lid?). Pressure and density fall as you go up through the atmosphere because of the effect of gravity, so why shouldn't temperature? Without gravity, there wouldn't be an atmosphere!
Molecules in the air are constantly moving and trying to reach an equilibrium. If a 'parcel of air' is slightly warmer than its surroundings, it will expand, rise and cool (these three go on tandem, you don't need to worry about what happens first). So it loses thermal energy (cools down) - and by rising, it gains potential energy. The potential energy doesn't come out of nowhere - thermal energy has been converted to potential energy.
For every 'parcel of air' that rises, other parcels move horizontally to fill the gap (aka 'wind'), and somewhere (over the Poles or on the night side) a parcel of air will be slightly cooler than its surroundings and it will fall to fill the gap left over by the last parcel that blew off horizontally. This parcel will be compressed into a smaller volume and its temperature will go up. That thermal energy doesn't come out of nowhere either - potential energy has been converted back into thermal energy. To use my terminology, the 'latent heat of convection' has been converted back into actual 'heat'.
Half way up the troposphere, a parcel of air has a certain amount of potential energy and a certain amount of thermal energy (that comes from solar radiation, which is our effective temperature of 255 K). The air above it will be cooler and the air below it will be warmer.
Summary... the Real Greenhouse Effect doesn't increase overall temperatures. It increases temperatures in the lower half of the troposphere and reduces them in the upper half. Same as a fridge, heat pump or vortex tube, which warm and cool simultaneously, they take thermal energy from somewhere and push it somewhere else. They do not increase overall average temperature or energy in the whole system. You don't get something for nothing!
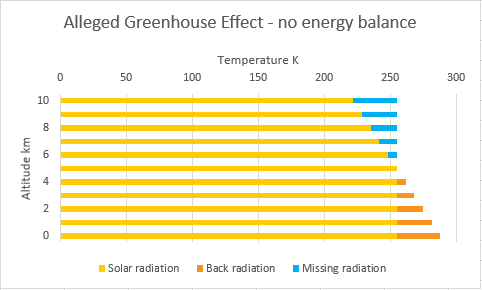
6. The Consensus view (to the extent it has a view, each climatologist offers two or three self-contradictory explanations) makes unsupported assumptions and reaches unrealistic conclusions (see for example here):
- in the absence of Greenhouse Gases, there would be no lapse rate, temperature would be 255K all the way up;
- Greenhouse Gases trap thermal energy at the hard surface/sea level by reflecting/re-radiating it downwards, making and lower layers warmer and the upper layers colder;
- potential energy can be ignored completely.
Which can be illustrated as follows:
--------------------------------------------
7. This appears to me to be science denial on a grand scale, and ignores and/or can't explain all the stuff we can observe and have reasonably good measurements for. If I had written the book, these would get a chapter each:
- it ignores the fact that the top of the troposphere and hence the peaks of very high mountains are a lot colder than we would calculate from solar radiation alone (see first chart). Their get-out is that Greenhouse Gases trap the heat lower down and keep the higher layers cooler, but that ignores potential energy completely and ignores the fact that mountain tops also receive solar radiation (so must be wrong);
- it ignores the fact that air is good at storing thermal energy, it warms slowly during the day and cools down even more slowly during the night. The total stored energy in the atmosphere and hard surface/ocean surface only goes up by 'a few per cent' on the day side and down by 'a few per cent' on the night side ('a few per cent' is probably about 5%). During the day, the air has a net cooling effect on the surface (like a car radiator) and vice versa during the night (like a radiator in a room);
- it ignores the fact that the oceans store more heat in their uppermost 3 meters than the entire atmosphere (let alone the thousands of metres of water below that);
- how clouds of hydrogen and helium gas contract to generate the pressure and temperature needed to kick start nuclear fusion;
- why there is a lapse rate on Jupiter or Saturn, even though their atmospheres are hydrogen and helium, which are officially not Greenhouse Gases (nitrogen and oxygen aren't officially Greenhouse Gases either). (Some astrophysicists consider Jupiter and Saturn to be failed stars - they are emitting more energy than than they receive from the sun, so must be gradually using up mass somehow);
- why the cores of Jupiter and Saturn are so hot, despite getting effectively zero solar radiation and why the hard surface of Venus is so hot, even though it only gets 17 W/m2 solar radiation (about one-tenth of what Earth's surface gets - clue - Venus' troposphere is heated from the clouds downwards using whatever the opposite of 'convection' is);
- why the Greenhouse Effect is stronger on the night side of Earth (which is getting zero solar radiation) and actually negative on the day side (which is getting all the solar radiation). The daytime temperatures on the surface of Earth are a lot cooler than the daytime temperatures on the Moon. On Venus, there is practically no difference between day and night surface temperatures;
- why the troposphere emits twice as much radiation or thermal energy towards the ground than it does out into space. The troposphere at sea level is warmer and hence emits more radiation that the layer higher up, which is colder and so emits less radiation, full stop.
- why water vapour and clouds (taken together) can't be a 'greenhouse gas', although this is based on observation as much as physics, which is really complicated.
- why the 'greenhouse effect' on Mars is barely measurable (no more than 5 degrees), even though there is twenty-five times as much CO2/m2 surface area as there is on Earth.
- why you can plot the Greenhouse Effect on Mars, Earth and Venus against the total mass of their atmospheres per m2 of surface and get a straight line, even though Earth's atmosphere is only 0.04% CO2 and Mars' and Venus' atmospheres are > 95% CO2.
- and so on and so forth.
It's all well and good having a theory or an explanation, but you have to be able to apply it to all the cases listed above and see whether they still hold. The kinetic-potential energy trade off explains 99% of all that without breaking a sweat. The Consensus have to invent all sorts of different explanations to paper over the cracks.
------------------------------------------
8. If I had a few million quid to spare, I'd settle the matter once and for all by buying an old industrial chimney or cooling tower - the taller the better - sealing it at the top, painting it white on the outside and insulating it with polystyrene on the inside walls, top and bottom - and then just measuring the temperature at top and bottom.
We would have real fun with this - we could test the theory to extremes by cutting holes near the top and bottom (on the side that gets the least solar radiation) and installing fans to pump in/suck out air; we would install radiators and cooling pipes at the top and bottom and turn them on and off; we would pump out the air and re-fill it with a mix of 80% nitrogen, 20% oxygen and zero Greenhouse Gases (H20, CO2 or methane).
I am quietly confident that, whatever you do; after you have turned off the pumps and closed the holes; or turned off whichever radiator or cooling pipes you had turned on; and left the column of air alone for long enough, the lapse rate will re-establish itself and the column of air will be cooler at the top than at the bottom by about 0.65 degrees per 100 metres of height (or nearly 1 degree if you manage to eliminate water vapour).
The only interesting thing left to resolve will be whether it takes seconds, minutes, hours or even days for the lapse rate to be re-established. If it hasn't happened after a week, if it's warmer at the top or if it's the same temperature all the way up, that's still a few million quid well spent and I shall spend a few quid more on a nice hat to eat.
I just wonder whether The Consensus would be prepare to enter into a bet and pay the costs if the explanation is correct. And I'll buy them a nice hat to eat as a consolation prize!
Before:

After:

And why did this take me nearly a whole week?
There are eighteen doors (and three drawers) which require eight steps (six for the drawers):
- remove door and knob,
- spray with degreaser, scrape off gunk, wash with soapy water and leave to dry,
- first coat all over with 1 part paint to 19 parts thinners to seal the surface a bit,
- drill additional holes for handles and counter-sink on the back (bolts were a bit too short),
- proper second coat on front,
- proper second coat on back,
- proper third coat on front,
- fit handles, re-fit door, faff about with hinges.
Including sticking up dust sheets so that I had somewhere to rest them while they dried, several trips to Screwfix, tea and fag breaks, and replacing two sets of hinges* which were completely knackered, it works out at about 1.5 hours per door and 1 hour per drawer, that's basically a full week's work.
* The new design Häfele hinges (£4.29 per pair) are brilliant. Once you've screwed the back plate to the side and popped the door on, you can adjust them for left/right and forward/backward (as on the previous design) but the new design has a third grub screw for up/down as well.
Following on from my last post on the subject, I was prompted to wonder what was actually causing the current warming trend, given that the greenhouse gas theory appears to have more holes in it than a colander. With a search engine at your fingertips, there is no need to wonder. This website provided a link to the Milankovic cycles, along with the following Consensus-orthodox disclaimer,
"The past 100 years of global warming and CO2 accumulation is an entirely different topic than this blog--since the past 100 years of CO2 accumulation and temperature change is far outside of any range shown in the natural history record----therefore clearly caused by man."
before showing a graph that proved the precise opposite, with a much higher peak than today recorded the last time around.
That could be awkward, I thought, so went to one of NASA's websites. Surely NASA would give the true picture.
Earth has experienced climate change in the past without help from humanity.
Well that's a good start, how do they explain that it was even hotter? They don't: all they do is state that, based on detailed data about the temperatures in the recent past which is not available for the previous ice ages, the rate of warming today is much faster than it has been before.
"But the paleoclimate record also reveals that the current climatic warming is occurring much more rapidly than past warming events. As the Earth moved out of ice ages over the past million years, the global temperature rose a total of 4 to 7 degrees Celsius over about 5,000 years. In the past century alone, the temperature has climbed 0.7 degrees Celsius, roughly ten times faster than the average rate of ice-age-recovery warming."
Unfortunately for the Consensus, a glance at their own graph shows that this is simply not true. During the recovery from the previous ice age the temperature is shown as rising 12C in less time than it has taken the temperature to rise 10C to today.
You wonder how they can do this with a straight face. Perhaps they don't.
Brian, follower of Deornoth linked to this in the comments.
Highly recommended viewing.
If you scroll down a bit there's a great deer-vs-cyclist clip in the comments, although that looks accidental rather than malicious.
From Hansen et al, 1981, page 6, column 3
We get the analogy of the leaky bucket: A bucket with a hole in it has water running into it at a constant rate and leaking out through the hole at the same rate, meaning that the level in the bucket remains the same. If the hole is made smaller, the level of the water in the bucket rises until the pressure is such that the flowrate of the water out through the new, smaller hole once again matches the flowrate of the water entering the bucket.
The bucket represents the Earth's atmosphere, the incoming water is incoming solar radiation and the outgoing water is heat radiated back from the Earth into space. The hole represents the Greenhouse Effect (GHE) controlling the outgoing radiation. As the CO2 levels in the atmosphere increase, so the GHE increases and outgoing radiation decreases. This is represented by the hole getting smaller. More heat retained causes the temperature to rise, and this produces more outgoing radiation until the equilibrium is re-established, just as the water level in the bucket settled down to a new, higher level.
Now the problem with this analogy is the same holds true for a change in the amount of water entering the bucket, assuming the hole remains the same size. More water coming in means that the level rises, less means it falls, therefore an increase in solar energy reaching the Earth would cause a temperature rise, a decrease a fall. However, this is not borne out by observations. From that ever-useful site, Skeptical Science, we find this graph:

This quite clearly shows that the amount of incoming radiation from the sun has been falling since about 1980. Up to that point, once you allow for a lag between increasing solar radiation and atmospheric temperature, there is a strong correlation between the two. After that there is none.
The only possible explanation is that the GHE only really kicked in around 1980, however a glance at CO2 levels over time, while it shows that the rate of increase of CO2 went up after 1960, does not show an increase that would account for almost zero affect up to 1980 and sufficient effect thereafter to cause warming despite a fall in the intensity of incoming solar radiation.
So either the rise in the water level in the bucket is due to more water coming in, which would be correct up to 1980, or it is because the hole is getting smaller, which would be correct from then on, but it can't be both.
The Consensus has no explanation as to why the 'Greenhouse Effect' is actually negative during the day - the surface is a lot cooler than it would be without any atmosphere (or 'greenhouse gases') whatsoever; but at night, the 'Greenhouse Effect' is larger than what they say it is (average 33 C at the Earth's sea level) even though there's no radiation coming in from the Sun.
It's impossible to disprove their basic logic by comparing predictions with outcomes because they keep bolting bits on (like the pre-Copernican model of the Solar System), with the end result that there isn't any coherent logic to disprove (believe me, I have tried working backwards from the IPCC's Global Energy Budget and couldn't reconcile it between day and night).
-------------------------------------------------------------
So that's today's chapter of my never-to-be-published book. Instead of trying to make sense of The Consensus, let's see if we can explain it using common sense and basic physics/maths and see where that gets us (like Copernicus starting again from scratch, rather than tweaking things by adding yet another concentric circle).
1. The sensible assumption is that the atmosphere acts like a blanket, it is warmed up by day (while shielding what is beneath it from the extreme highs) and gives off/loses that stored warmth by night. (An Economy 7 heater does the opposite). And that would be correct, but we shouldn't take analogies too far, so let's do the numbers. See caveats/footnote*.
2. We set up our spreadsheet again and type in the variables to predict hard surface temperatures for the Moon and a desert at the Equator on Earth, just to make sure we have used the right equations and get sensible answers. The Moon can get a bit hotter than 108 C, but its day is much longer, so that looks about right.
3. But deserts do not all warm to 73 C - that's the clue bat! The typical/average day time temperature is 32 C (the highs can be higher), this works backwards to 500 W/m2 being received/emitted. At night the deserts cool to just above freezing (the lows can be lower), which works backwards to 328 W/m2. Those 328 W/m2 aren't coming from the Sun (it's night time), they are coming from/being emitted to the boundary layer. That gives us a typical diurnal temperature variation of 30 C and total average W/m2 received/emitted of 828 W/m2 over 24 hours. (To use two fancy new phrases I learned recently).
4. When the sun is directly overhead a dry desert at the Equator, total 1,380 W/m2 is coming in (Joules per second per m2), of which 40% is reflected (albedo = 0.4), leaving 828 W/m2 to be absorbed/stored as warmth. The hard surface absorbs 60% (500 W/m2) and the boundary layer absorbs 40% (328 W/m2), so it all reconciles very nicely (after some trial and error).
5. As you can see, we do not need to add or subtract any 'back radiation' from 'greenhouse gases' - and why go looking for something if there is no evidence for it? We do not need to distinguish between conduction, convection and radiation or worry about whether or not air can absorb/emit infra red. And it's the dry desert, so we don't need to worry too much about the Latent Heat of Evaporation/Condensation either. We just need to apportion the total energy budget (828 W/m2) sensibly between hard surface and boundary layer; between day and night; between warming and cooling (etc etc, it's all a bit circular) to get sensible answers.
Here are the workings for you to reverse engineer and check. 32C and 2C are highlighted yellow to show they are my assumptions, the maths then follows as sure as night follows day...

* Caveats/footnote
As a separate topic, the Real Greenhouse Effect warms the surface overall - and cools the upper atmosphere. That has to do with the vertical energy distribution (aka 'lapse rate') and not the day-night difference, which is what we are considering here.
The Real Greenhouse Effect is only about 18 K, not the much vaunted 33 K, because if you assume no atmosphere (and no 'greenhouse gases'), there would be no clouds either, which would bring down Earth's overall albedo from 0.3 to 0.1 - two-thirds of the visible surface would be oceans with albedo 0.06 and one-third dry land with albedo 0.18, average 0.1. The lower albedo would mean an effective (and likely actual) temperature of 270 K (a bit higher then on the Moon because of lower albedo). Compare this with actual average temperature (with atmosphere and clouds etc) of 288 K = Real Greenhouse Effect 18 K.
The equilibrium vertical energy distribution takes time to establish and maybe it never is. "Weather" is just the atmosphere's way of trying to attain that equilibrium and its work never ceases. Here we are just looking at a 24-hour period in isolation; focusing on the difference between day and night temperatures rather than absolute temperatures; and making the simplistic assumption that the lower troposphere is warmed from the ground upwards and both cool in tandem, which is true on a short timescale.
From the BBC:
Labour has urged the Conservative Party to repay a £12,000 donation it received from a developer 14 days after Housing Secretary Robert Jenrick approved a £1bn building project.
Shadow housing secretary Steve Reed said the decision raised concerns about "cash for favours". And the Lib Dems want an investigation into the minister's conduct. But the government said Mr Jenrick had acted with propriety and retained the PM's "full confidence".
On 14 January, the housing secretary granted permission for Richard Desmond's company Northern & Shell to build on the Westferry Printworks site on east London's Isle of Dogs. The businessman - a former owner of the Daily Express - made a personal donation to the Conservatives two weeks later, on 28 January.
Mr Jenrick's approval for the Westferry scheme came the day before the introduction of a new council community levy, which would have meant the company paying an additional £40m. It has also emerged that Mr Desmond and Mr Jenrick sat at the same table at a Conservative Party fundraising dinner last November.
All a series of complete coincidences and entirely innocent, I'm sure.
Which brings us back to BenJamin's idea, that all direct donations to political parties should be completely illegal. Instead, people have to pay the money to the Electoral Commission, who pool it and pay each party a single, anonymous total at the end of each calendar quarter. So no politician will ever be sure that somebody has paid the bribe donation they promised.
And lest ye think that I am bashing the Tories - Labour and the Lib Dems have been involved in similar entirely innocent and above board series of coincidences as well.
Data from the ONS.

We're not quite at 'undershoot' yet, but watch this space.
Emailed in by Tim W, from The Times:
Henry ‘Bud’ Flintoff, GC, obituary
Labourer whose bravery in rescuing a farmer from a raging bull as a schoolboy won him the highest civilian award for gallantry.
Henry Flintoff, known since boyhood as “Bud”, was a lad of 13 when he was faced by a situation that only swift and courageous action could resolve. In June 1944 he was a schoolboy working on a farm near his home in Yorkshire, a wartime practice for which many youngsters volunteered, when he heard a cry for help from the next field. He ran to the scene to find the farmer being attacked by a fully grown bull.
While being driven into the field the bull had turned on the farmer and charged, knocking him to the ground. The beast was kneeling on the farmer’s chest when Bud reached him. Although the farmer’s stick lay close by, Flintoff realised that it would be worse than [rest behind paywall]
As I pored over my master Greenhouse Effect spreadsheet after work today, another thing struck me (and which I have glossed over so far, it being a tricky topic).
We calculate the 'dry lapse rate' as 9.75 K/km, that's easy enough to understand. But the measured real-world 'moist lapse rate' is only 6.5 K/km. We know that water is a moderating influence, so we correctly put it down to water, water vapour and clouds with a hand wave, but how do we know it must be one-third lower than the 'dry lapse rate' for everything else to makes sense?
Let's do the numbers... (UPDATE: if you want to see the official equation, see www.theweatherprediction.com. Comes to the same thing, I just like to do stuff step-by-step).
---------------------------------
If you need a refresher...
Rule 1, energy cannot be created or destroyed, it just changes from one form to another.
Rule 2, energy tries to spread out as evenly as it can, taking into account the medium and the forms it can take within the restraints of that medium.
I don't like the 'parcel of air' analogy, but it will do for now. Air cools as it rises, so converts kinetic energy (aka 'heat' in layman's terms) into some other form of energy. What kind of energy does it convert into? Easy - it changes into potential energy (think about it for a minute or two).
1 kg of air higher up has the same total amount of energy (of all forms) as 1 kg at sea level. Kinetic energy (mass x specific heat capacity, referred to as Cp, dunno why) has changed into the same amount of potential energy (mass x height x acceleration due to gravity). The fall in temperature is called the 'lapse rate'.
Maths of the 'dry lapse rate':
Joules converted = mass x change in height x gravity = mass x change in K (temp) x Cp.
Cancel 'mass' on both sides.
g x change in h = change in K x Cp.
Reshuffle that, you get
Change in K ÷ change in height = g ÷ Cp.
9.807 m/s2 ÷ 1,006 J/kg = 9.75 K/km
(see Wiki for the hopelessly confusing explanation with the same end result).
----------------------------------
So far so good. The easy bit is PE gained = KE lost, but there's some energy unaccounted for.
PE gained is easy:
1 kg of air at sea level has no PE for these purposes. It can't fall any further.
1 kg of air 1,000 metres above sea level has 1 kg x 9.807 m/s2 x 1,000 metres = 9,807 Joules of PE.
So 9,807 Joules of energy, mainly of KE ('heat'), have changed into PE.
We know it has cooled by 6.5 K and that the specific heat capacity of air is 1,006 J/K/kg. So only up 6,539 Joules of KE have been converted into PE.
That leaves 3,268 Joules unaccounted for, doesn't it?
The missing figure is latent heat of evaporation of evaporation/condensation ('LHEC'). The ground and the ocean surface get radiation (energy) from the Sun, reflect a bit and convert two-thirds of the rest into KE and one-third into LHEC. I'm sure this is not a fixed ratio; in the desert, there's no water to evaporate; if it's colder, then not much water evaporates anyway etc.
1,000 metres higher up, just under 1.5 grams of water vapour per kg of air (approx. one quarter of the water vapour per kg of air at 15C, sea level pressure and 50% relative humidity) condenses, freeing up 0.0015 kg x 2,264,705 J/kg = 3,268 Joules of LHEC in addition to the 6,539 Joules of KE that 1 kg or air already had, and all 9,807 Joules then end up as PE.
Which is why the 'moist lapse rate' observed in the real world is 6.5 K/km, not 9.75 K/km.
(6,539 Joules KE converted ÷ 9,807 total Joules converted) x 9.75 K/km dry lapse rate =
6.5 Joules KE converted per km = moist lapse rate.
--------------------------------
I know I'm reinventing the wheel here, and I'd hope that this is all old hat to people who've got a physics A-level or degree, but why don't they give this sort of fun stuff the same coverage as all the other Greenhouse Effect-related stuff?
And why does the IPPC's energy budget show that the hard surface only converts one-sixth of incoming radiation into LHEC and not one-third?
(Rhetorical questions, we know the answers, which I will cover soon).
-------------------------------
While checking my numbers, I stumbled across this fine article (ignore the ghastly typo in the title, I've made that same mistake many a time), well worth a read if you are into maths and are a bit dubious about the Consensus.
This will be one of the first chapters in my book, if I ever get round to writing it.
1. Work out total mass of atmosphere of Mars, Earth and Venus per m2 (divide surface pressure in Pascal N/m2 by acceleration due to gravity m/s2).
2. Work out 'effective temperature' (based on incoming radiation W/m2, albedo of surface/cloud cover, Stefan-Boltzmann constant 5.67/10^8).
3. Work out lapse rate (acceleration due to gravity m/s2 ÷ specific heat capacity of constituent gases based on temperature at hard surface J/K/kg)
4. Work out hard surface temperature by adding lapse rate x altitude of "mean radiating altitude" (which to all intents and purposes is the same as the average altitude of cloud cover, that being the first thing the solar radiation interacts with when it hits a planet and the thing which on which albedo is based).
For clarity - steps 3 and 4 are just for fun. You can skip these and go straight to step 5 - the actual measured hard surface temperature - because that is the one you subtract from 'effective temperature' (from 2 above) to calculate the total Greenhouse Effect!
5. Look up actual average surface temperature in K and make sure it tallies with your answer 4.
6. Subtract 'effective temperature' from actual hard surface temperature to find magnitude of The Greenhouse Effect. Plot the results for all three planets against mass of atmosphere/m2 using logarithmic axes and add a line of best fit.
7. Oh my, it's all a straight line. Which is what you'd expect anyway:

8. It's a shame that our estimates for the total mass of the Gas Giants and their temperature at the core i.e. their hard surface are so vague, it would be nice to see if they fit the pattern.
If you follow the Consensus' logic, it leads to two possible, completely opposite conclusions on what happens to the "mean radiating altitude" and the Greenhouse Effect (using the flawed Consensus definition) if the surface temperature goes up... depending on the reason why surface temperatures go up.
Let's not do Diagonal Comparisons, let's assume surface temperature goes up by 3 K. In Case 1 it's because of more CO2; and in Case 2 it's because of less cloud cover. In each case, I am following Consensus logic and Consensus rules of the game
Here goes...
Constants in Case 1 and Case 2:
Earth has a certain amount of solar radiation coming in (minus amount reflected back to space - depends on albedo).
Earth has to radiate the same amount of radiation back to space.
Lapse rate can be calculated independently as 6.5 K/km.
To get things to balance on Earth, the values for the "mean radiating altitude" aka the "mean absorbing altitude" are as follows:
Altitude - 5 km
Temperature - 255K
Radiation absorbed/emitted by that layer - 239 K/Wm2 (342 W/m2 gross adjusted for 0.3 albedo = 30% sun light reflected back to space and 70% x 342 W/m2 absorbed).
Hard surface temperature - 288 K.
Check - "the Greenhouse Effect", using the Consensus definition is either simply 288 K minus 255 K = 33 K, or you can calculate it as 5 km x 6.5 K/km = 33 K.
Case 1 - higher surface temperature means higher "mean radiating altitude" and a larger Greenhouse Effect
We change one variable:
Average surface temperature goes up by (say) 3 K, from 288 K to 291 K.
Reason - this is caused by an increase in CO2. Cloud cover unchanged.
Lapse rate is fixed, so at each altitude, temperatures go up by 3 K.
If you want to find the altitude at which temperature is 255 K, you know have to go up to 5.5 km altitude (higher than our base case).
Check - 291 K surface temperature minus 5.5 km x 6.5 K/km lapse rate = 255 K.
The "Greenhouse Effect" using the conceptually flawed Consensus definition has gone UP and is now 291 K minus 255 K = 36 K.
---------------------------------------------------------------------
This is part of the Holy Canon of Climate Change.
Today's Lesson is from Hansen et al, 1981, page 1, column 3:
"the
greenhouse effect of gases and clouds... cause the mean radiating level to
be above the surface"
So the higher The Greenhouse Effect, the higher the "mean radiating level".
Amen.
Case 2 - higher the surface temperature means lower "mean radiating altitude" and a smaller Greenhouse Effect
We change one variable:
Average surface temperature goes up by (say) 3 K, from 288 K to 291 K.
Reason - this is caused by there being no cloud cover at all (as happened in the UK in April and May this year). CO2 levels unchanged.
So albedo falls to 0.15, so 85% of sun light is absorbed.
Radiation absorbed/emitted at "mean radiating altitude" - 291 W/m2 (342 W/m2 gross adjusted for 0.15 albedo = 15% sunlight reflected back to space and 85% x 342 W/m2 absorbed)
This pushes up temperature of "mean radiating altitude" from 255 K to 267 K.
Lapse rate is fixed, so at each altitude, temperatures go up by 3 K.
If you want to find the altitude at which temperature is 267 K, you have to go up to 3.7 km altitude (lower than our base case).
Check - 291 K surface temperature minus 3.7 km x 6.5 K/km lapse rate = 267 K.
The "Greenhouse Effect" using the conceptually flawed Consensus definition has gone DOWN and is now 291 K minus 267 K = 24 K.
Which is yet more evidence that the whole thing is nonsense
The Consensus view appears to hinge on Case 1 being correct, that higher surface temperature means that the "mean radiating altitude" and the The Greenhouse Effect will be higher (I have no idea why they make such a big thing out of this, but hey, the Gospel according to St James [Hansen] says so).
My problem is that if you make all the same assumptions, only you change the reason for the temperature increase to something pretty easily measurable and inarguable (less cloud cover) the "mean radiating altitude" and The Greenhouse Effect will be lower.
This illustrates that the Consensus logic is completely wrong somewhere and their way of measuring the Greenhouse Effect is conceptually flawed.
The only way to reconcile the two Cases is to accept that The Real Greenhouse Effect is dictated solely by the thickness/mass of the atmosphere and is entirely independent of the constituent gases. In Case 1, the surface temperature and hence everything else is unchanged. In Case 2, yes, temperatures go up by 3 K, you don't need to be a genius to work that out. I just told you they did and why.
Guest post by James Hansen.
-----------------------------
In the 1970s, I made up my mind that rising CO2 levels were the cause of rising temperatures. Nobody really knew whether this was cause-and-effect (and if so, which causes which); correlation (a third factor causes both); pure coincidence; or just one of those things we'll never be able to explain - maybe these warmer phases come every thousand years or so (Roman warm period, Mediæval warm period, Modern warm period...), but I decided to stake my career on it.
I didn't have much evidence - at the top of page 1, column 2, I clearly stated "The major difficulty in accepting this theory has been the absence of observed warming coincident with the historic increase. In fact, the temperature in the Northern Hemisphere decreased by about 0.5C between 1940 and 1970; a time of rapid CO2 buildup." (my children call this a 'spoiler'; my grandchildren call this a 'clue bat'), so I twisted the facts to fit my logic. I did a Diagonal Comparison, reversed cause and effect and then covered my tracks a bit by using technical jargon.
There is of course a Greenhouse Effect. Broadly speaking, all else being equal, the thicker the atmosphere, the warmer the hard surface will be. The atmosphere is like a blanket. It warms up and cools down slowly, it keeps the hard surface a bit cooler by day time and a lot warmer by night. Surely people can work this out intuitively? What the atmosphere's constituent gases are is pretty irrelevant, all that really matters is their specific heat capacity (which is not much different for nitrogen, oxygen or CO2 - see below). Ozone is a special case (that actually does have an effect). But 'Greenhouse effect' is neat shorthand, so I hijacked the term and made up my own explanation for it.
Luckily, CO2 levels and temperatures have continued rising since my 1981 essay, so everybody heralds me as a visionary genius and assumes that my logic was sound. I'm really surprised that nobody ever noticed the sleights of hand, not even those we deride as Climate Skeptics or dismiss as Science Deniers who are out to debunk it all.
Nonetheless, like any great showman at the end of his career, I now want to tell the world how I did it (not least because regular commenter Dinero posted a link to my original essay here, and our blog host saw straight through it and will blow the gaff if I don't do it first).
Start with some basic physics and maths
As any physicist knows, you can calculate the expected temperature of the visible surface of a planet by working out the average amount of solar radiation each m2 gets from the Sun (over the planet's day); deducting the amount that is reflected back to space; dividing that by the Stefan-Boltzmann Constant (5.67/10^8); taking the fourth root of the result; and that's your temperature in degrees K.
Here are the workings:

The Stefan-Boltzmann Constant is derived from observation and trial and error; you can tweak the figure for albedo a bit (nobody knows the exact values) and so of course it all stacks up and is a good match for measured temperatures.
Don't forget that we take (white) cloud cover into account when calculating how much radiation is reflected straight back to space, so the end-result of our calculations is the expected temperature of the cloud cover (to the extent that the planet has cloud cover) at that altitude (i.e. the altitude of the visible surface)...
- The altitude of the visible surface of Venus is 65 km, the mid-point of the cloud cover, which is between 50km and 80 km altitude.
- The average altitude of the visible surface of Earth is 5 km altitude. Earth's visible surface is two-thirds cloud cover, mainly in the upper half of the atmosphere - effective altitude 7.5 km - and one-third hard surface or open ocean - altitude zero - so the overall weighted average altitude of the visible surface is at an altitude of approx. 5 km.
- The average altitude of the visible surface of Mars is 1 km. Mars has very little cloud cover, but there are dust storms. On average, the visible surface is barely above the hard surface, call it 1 km for sake of argument.
Of course, simply referring to this as "the expected temperature of the visible surface, be that cloud cover or hard surface, at the average altitude of the visible surface" would have made the next logical leap too transparent, so I used the term "effective temperature" instead, a term whose meaning is not immediately obvious.
Trick 1 - the Diagonal Comparison
Having shown that I can plug numbers into equations and get the right answer, I then did a Diagonal Comparison. I compared the temperature of the visible surface (at a high altitude, now referred to as "effective temperature") with the actual measured hard surface temperature (at zero altitude) and called the difference 'The Greenhouse Effect', which I explained with the hand wave "the excess... is the greenhouse effect of gases and clouds".
It's like a green grocer telling you that potatoes are more expensive than tomatoes, because 5 lbs of potatoes costs $1.50, but 1 lb of tomatoes only costs $1. You might fall for that one, but my table below is like me telling you that potatoes are more expensive than tomatoes because 1 ton of potatoes costs $600 and 1 lb of tomatoes costs $1.

Luckily, most people just stop reading here. They put 2 and 2 together to make 507. The atmosphere of Venus is 95% CO2, so my followers talk about "the runaway Greenhouse Effect" and sound plausible. In truth, if you follows the basic maths and physics outlined below, 2 plus 2 still makes 4. There's no geometric effect, and not even a logarithmic effect (Heaven only knows why the Skeptics set off on that road).
Some more basic physics and maths
Having established the expected temperature at a certain altitude, it's not difficult to estimate the temperature of the hard surface and to get your estimate to match up to measured temperatures.
The atmosphere gets cooler the higher up you go; which is another way of saying that it gets warmer as you descend to ground level. This is the lapse rate (which we insiders call 'adiabatic lapse rate' to sound clever). The lapse rate is actually easy to work out. You just have to understand that the kinetic energy (heat) in air lower down is converted to potential energy as it rises (and vice versa); heat is 'used' to lift the air, which gives it more potential energy (and vice versa as it descends). You calculate the lapse rate as gravity ÷ specific heat capacity of the air.
How to work out the lapse rate:

[What tickles me here is that I openly admitted that water vapour and clouds reduce the lapse rate by one-third. To quote from my 1981 essay "The [moist] lapse rate is less than the [predicted] value because of latent heat release by condensation as moist air rises and cools". That part is actually true - moist air releases heat as it cools - but I explained it so briefly that most people would either not understand it or ignore it
Now that my followers have been forced to admit that the effect of CO2 must be far lower than they want it to be, they are falling back on the Positive Feedback effect of water vapour (and ignoring the inevitable clouds, which more than cancel it out).]
Finally, you estimate the expected hard surface temperature. You start with the estimated effective temperature from above; multiply the lapse rate by the altitude of the visible surface; and add them together. Stands to reason - the thicker the atmosphere (and lower the hard surface is relative to the cloud cover), the higher the temperature at the hard surface. Not even the most hardened Skeptic or Denier disagrees on this; it's common sense. The end results are very close to measured temperatures (unsurprisingly, because you can tweak all the variables a bit):

Once you know how and why the hard surface temperature arises, the 507 K on Venus doesn't seem nearly so scary, does it? That's why I had to do the Diagonal Comparison instead and pull 507 K straight out of nowhere to shock people.
Trick 2 - reversing cause and effect
Of course, using the proper chain of logic and cause and effect (as above) would have given the game away, so I reversed the logic and swapped cause and effect - I had to show that a higher hard surface temperature led to less radiation going into space (seriously, I'm surprised anybody fell for this).
To quote from my 1981 essay again, "The mean surface temperature [on Earth] is 288 K. The excess ['effective temperature' less hard surface temperature] is the greenhouse effect of gases and clouds, which cause the mean radiating level to be above the surface... the atmospheric composition of Mars, Earth and Venus lead to mean radiating levels of about 1 km, 6 km and 70 km and lapse rates of 5 K/km, 5.5 K/km and 7 K/km*"
(* the current agreed values differ slightly, but I deserve credit for being pretty close).
You note that this is where I circle back to "greenhouse... gases" out of nowhere, adding the vague phrase "the atmospheric composition", even though the entire trail of physics so far clearly shows that the only thing that matters is their specific heat capacity and hence the lapse rate.
The lapse rate on Earth is slap bang in the middle of the lapse rates on Venus or Mars, even though "the atmospheric composition" on Earth is completely different to that on Venus or Mars. So more gullible readers must have assumed that the atmospheric composition on Earth is similar to that on Venus or Mars, even though I never actually said that, did I?
Having admitted that water vapour and clouds reduce the lapse rate by one-third, the more discerning reader should have been able to work out that even if we had 95% CO2 in our atmosphere, the lapse rate would be 9.807 m/s2 ÷ 0.846 J/K/kg = 11.6 K/km, reduced by one-third for water vapour and clouds = 7.7 K/km. The visible surface would still be 255 K at 5 km altitude, so the hard surface temperature would increase to 255 K plus 5 km x 7.7 K/km = 293 K, that's an upper limit of 5 K 'global warming' resulting from CO2 concentrations going up from 400 ppm to 950,000 ppm.
Having fooled people with the "runaway Greenhouse Effect on Venus due to CO2", nobody expected to see me admit that there's nothing to worry about.
If you read my essay properly, you'll see that I started with the temperature of the hard surface and subtracted a lapse rate* to arrive at the temperature at the altitude of the visible surface, which in real life is the first thing you work out, not the last. The figures 1 km, 5 km and 70 km are our starting points for the calculations, not the end results! In the US, we call this "arse backwards", I believe you Brits call it "arse over tit".
* It's nonsense to work out a lapse rate the way I did, by dividing the altitude of the visible surface by the difference in temperature between hard surface and visible surface. You can work out the lapse rate independently (see above) and then you multiply that by the altitude, etc. On either side of The Pond, that's called a circular calculation and Excel will give you an error message.
It's like a green grocer saying, "Well, 5 lbs of potatoes cost $1.50, so the price for 1 lb must be 30c", when in fact, he decides the price per lb first; you tell him how many lbs you want to buy; and then he works out the total price in $.
Covering my tracks
I referred to the altitude of the visible surface (i.e. the cloud cover, which anybody can understand) as "mean radiating level" and/or "the flux-weighted mean altitude of the emission to space". Why use an easily understandable concept if an impenetrable one will do?
I started the section headed Greenhouse Effect as follows "The effective radiating temperature of [a planet] is determined by the need for infrared emission from the planet to balance absorbed solar radiation". I then gave the long version of the equation for working out the temperature of the cloud cover based on solar radiation coming in (easier to understand) and said it was the equation for working out the temperature of the layer which radiates to space (conceptually more difficult to understand, although the two equations are the same, you just reverse cause and effect).
Well of course the temperature of the layer that absorbs radiation is the same as the temperature of the layer than emits radiation - it's the same layer! But it distracted people from the fact that I had wasted two whole columns explaining how to work out backwards how high the cloud cover is (to the extent that a planet has a cloud cover), which is easy, you just measure it!
In practice, most of the cloud cover is most of the top half of the troposphere, on Earth as it is on Venus (the dust clouds on Mars are more at surface level). I admitted as much in page 2, column 3: "Study of Venus suggests that some clouds occur at a fixed temperature. The Venus cloud tops, which are the primary radiator to space; are at [the altitude of] 70 km, where the [actual measured temperature = the expected temperature]". .
So really, I wasted two whole columns saying that "the cloud cover is at 70 km because the cloud cover is at 70 km". But I had the good sense to squeeze in some pseudo-scientific babble in between and/or gamble on nobody reading that far.
You don't believe me?
Now I've explained how I did it, just re-read page 1, column 3 and page 2, column 1 of my 1981 essay and see if you can spot how I papered over the cracks:
http://climate-dynamics.org/wp-content/uploads/2016/06/hansen81a.pdf
(copy that URL into your browser, I'm too old for hyperlinks).
Please don't kick yourselves too hard, a whole generation of scientists and 'activists' fell for it as well!
With best wishes,
James Hansen
PS, if you have any questions, please write to me at:
James Hansen
c/o Climate Science, Awareness and Solutions
Earth Institute, Columbia University
475 Riverside Dr. Ste 401-O
New York, NY 10015


